. 2001 Feb 1;21(3):759-70.
doi: 10.1523/JNEUROSCI.21-03-00759.2001.

Theta-frequency bursting and resonance in cerebellar granule cells: experimental evidence and modeling of a slow k+-dependent mechanism

Affiliations

Theta-frequency bursting and resonance in cerebellar granule cells: experimental evidence and modeling of a slow k+-dependent mechanism

E D'Angelo et al. J Neurosci. .

Abstract

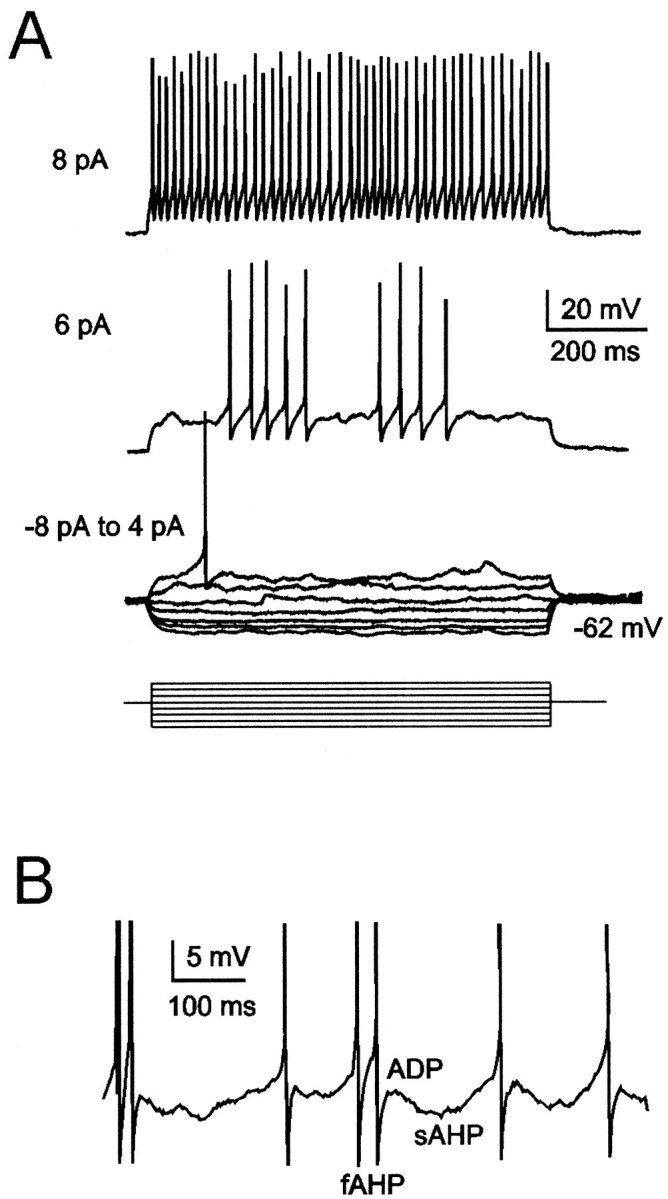
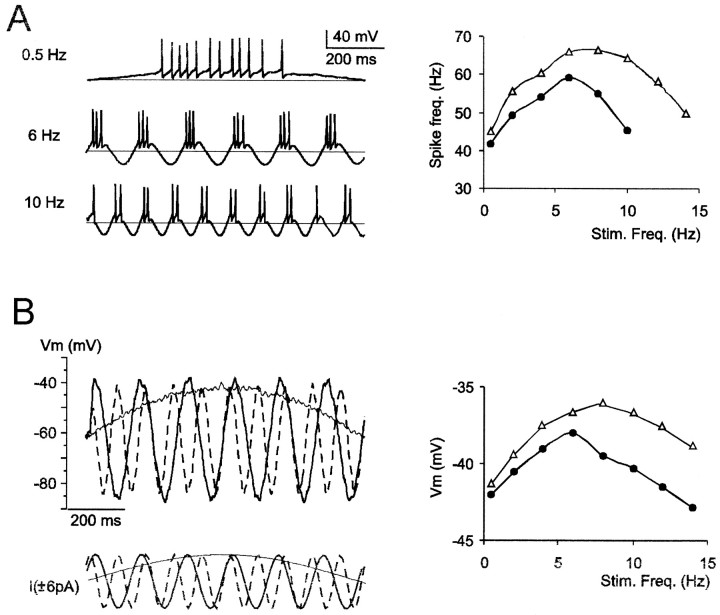
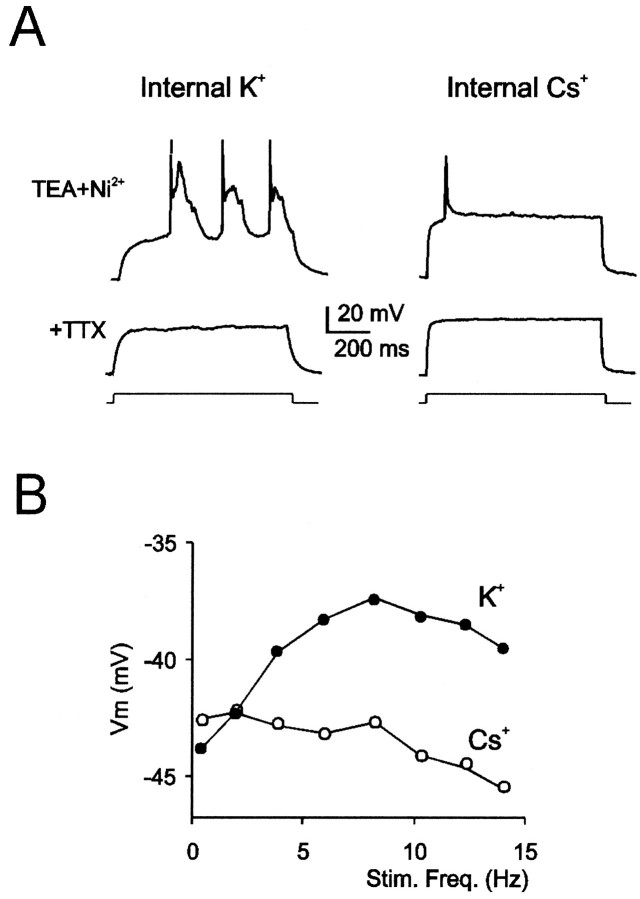
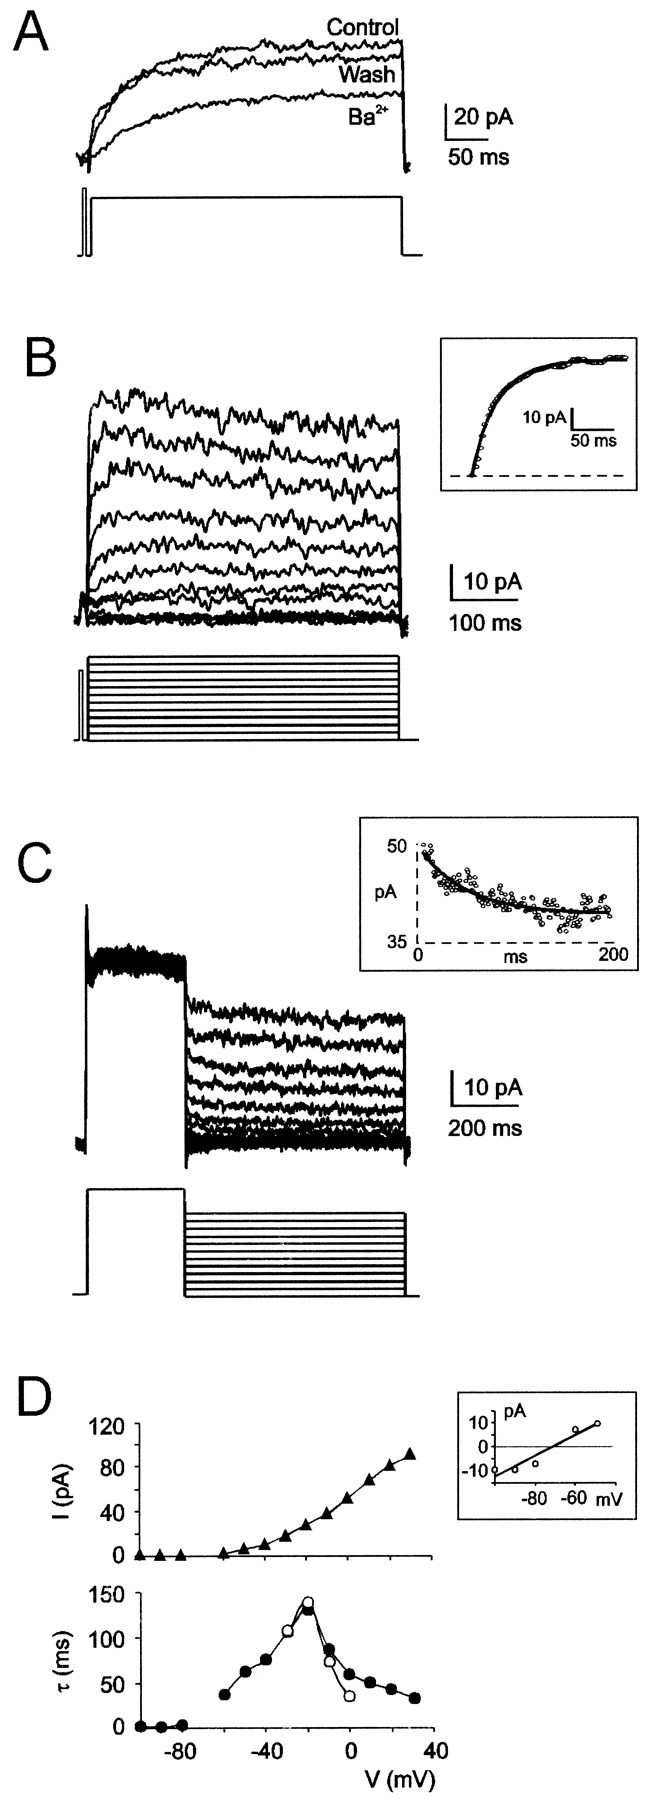
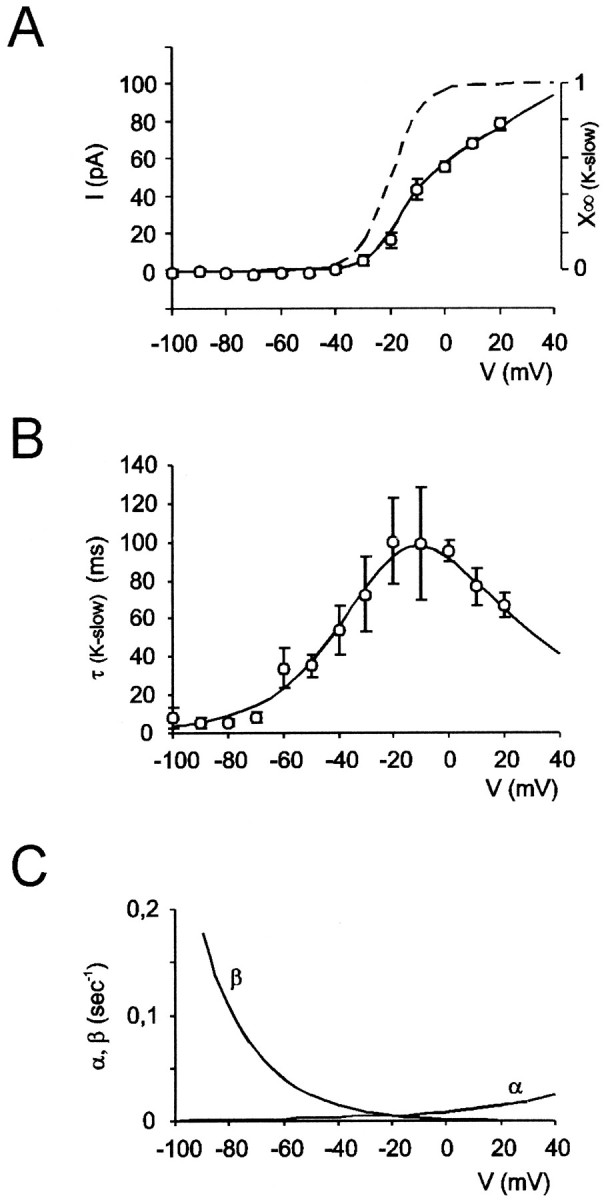
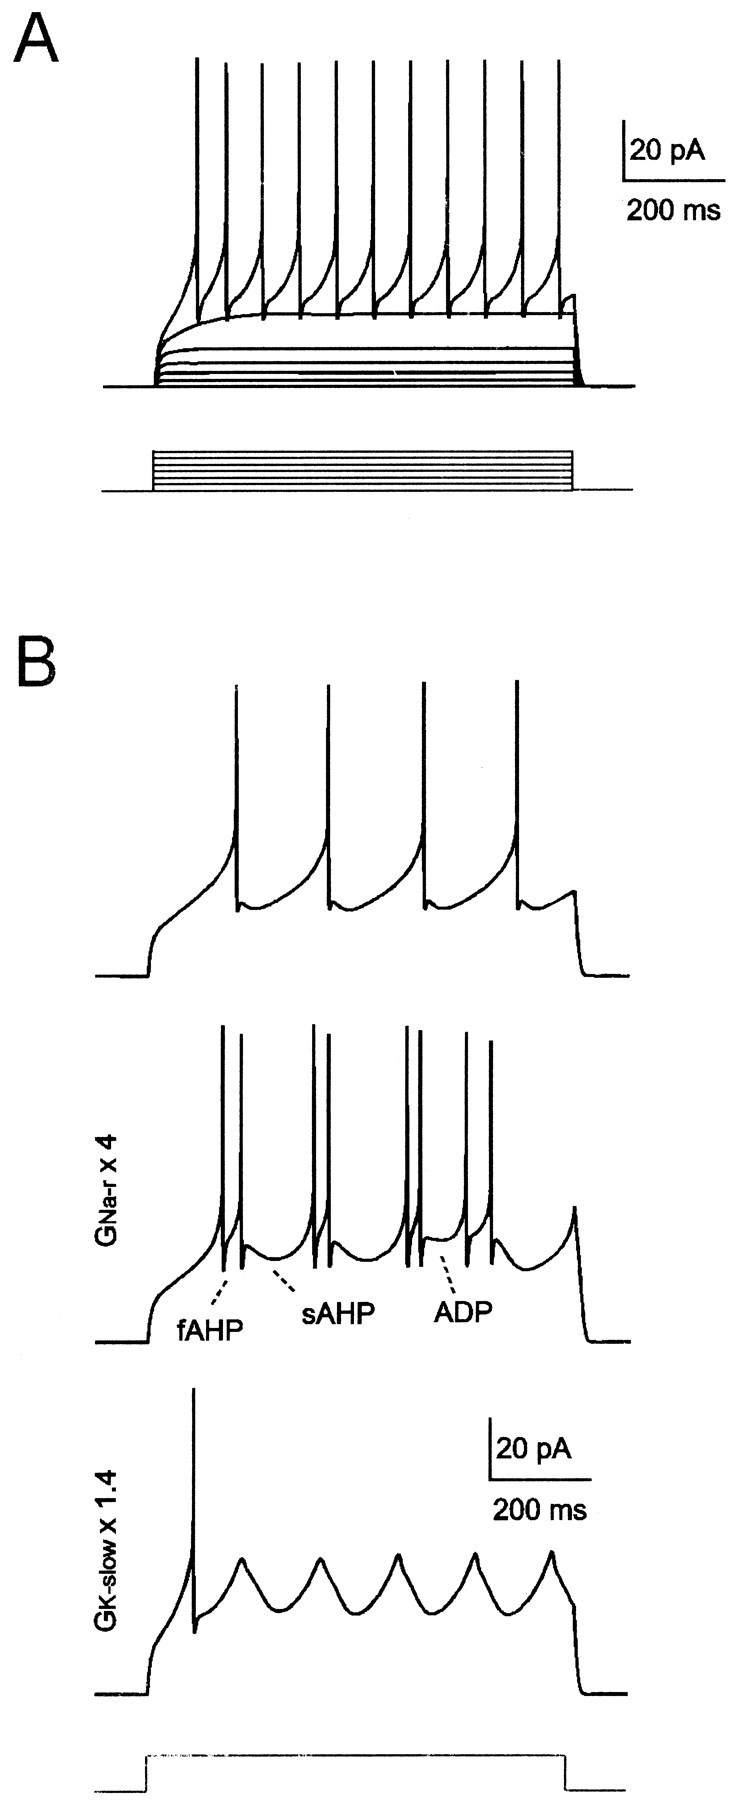
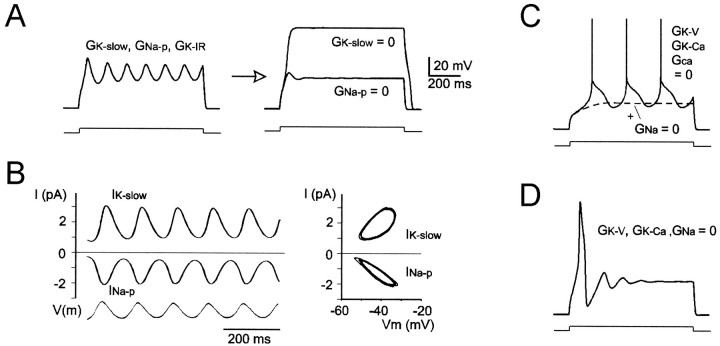
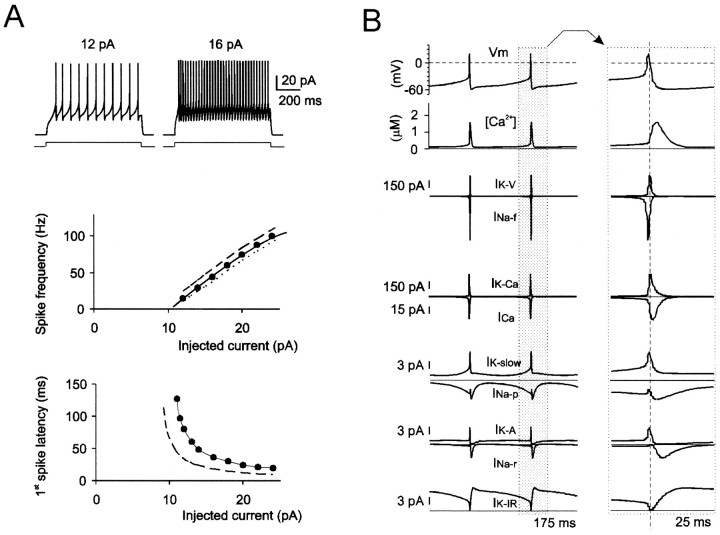
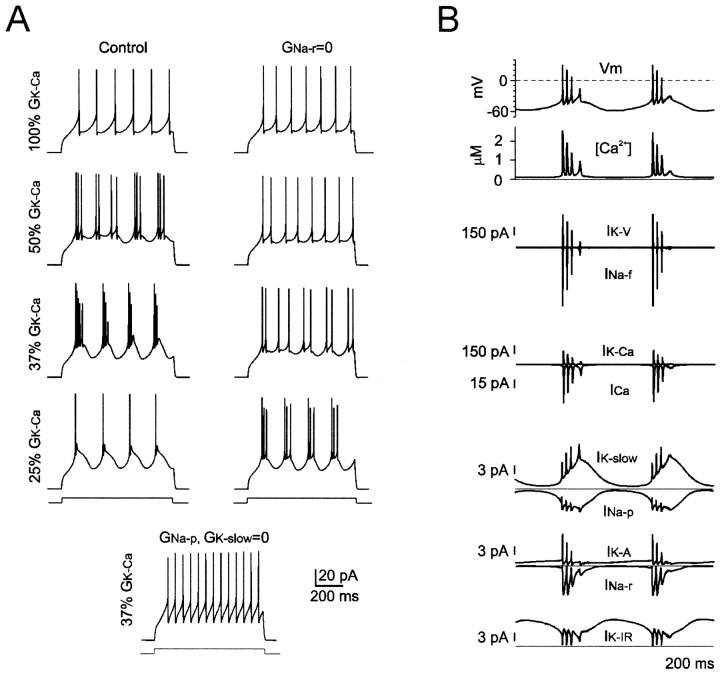
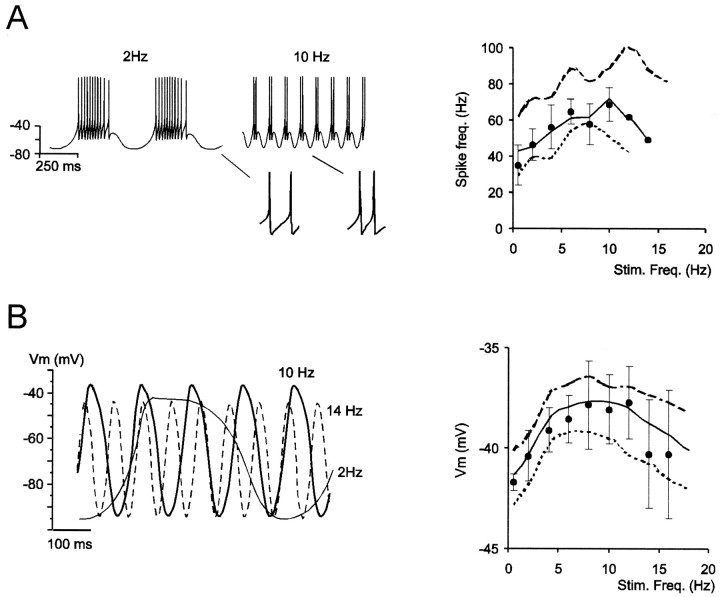
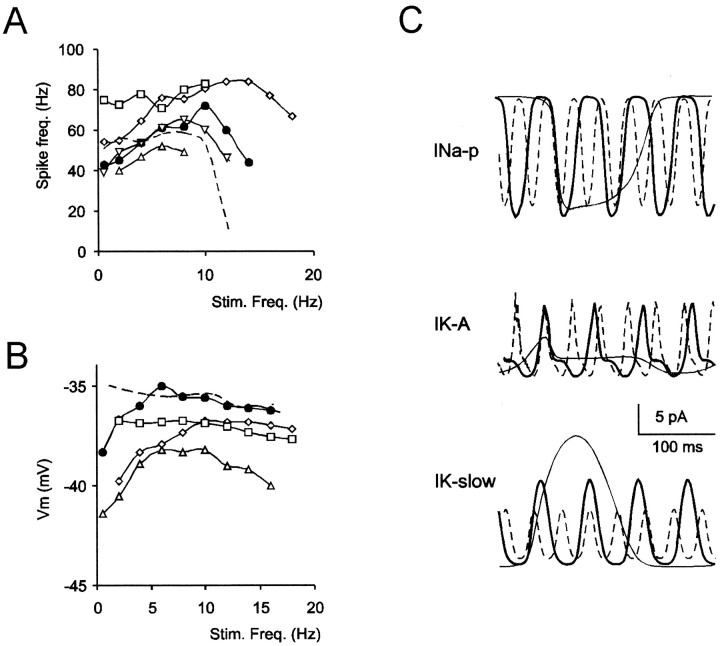
Neurons process information in a highly nonlinear manner, generating oscillations, bursting, and resonance, enhancing responsiveness at preferential frequencies. It has been proposed that slow repolarizing currents could be responsible for both oscillation/burst termination and for high-pass filtering that causes resonance (Hutcheon and Yarom, 2000). However, different mechanisms, including electrotonic effects (Mainen and Sejinowski, 1996), the expression of resurgent currents (Raman and Bean, 1997), and network feedback, may also be important. In this study we report theta-frequency (3-12 Hz) bursting and resonance in rat cerebellar granule cells and show that these neurons express a previously unidentified slow repolarizing K(+) current (I(K-slow)). Our experimental and modeling results indicate that I(K-slow) was necessary for both bursting and resonance. A persistent (and potentially a resurgent) Na(+) current exerted complex amplifying actions on bursting and resonance, whereas electrotonic effects were excluded by the compact structure of the granule cell. Theta-frequency bursting and resonance in granule cells may play an important role in determining synchronization, rhythmicity, and learning in the cerebellum.


Figures

Fig. 1.
Fig. 1.
Granule cell electroresponsiveness during step current injection. A, The injection of current steps (from −8 to 6 pA, resting potential = −62 mV) causes inward rectification in the hyperpolarizing direction. Spikes are activated around −40 mV. The tracing at 4 pA shows a single spike, the tracing at 6 pA shows spikes clustered in two bursts, and the tracing at 8 pA shows regular repetitive firing. B, Just-threshold response illustrating spike fast afterhyperpolarization (fAHP), slow afterhyperpolarization (sAHP), and afterdepolarization (ADP). The neuron in B is different from that in A(spikes are truncated). Recordings in this and the following figures were performed in the presence of 10 μmbicuculline.
Fig. 2.
Fig. 2.
Resonance in a cerebellar granule cell (same cell as in Fig. 1A). A, Injection of sinusoidal currents at various frequencies (0.5–40 Hz) reveals resonance in burst spike frequency, which was measured by dividing the time period between the first and last spike in a burst by the number of interspike intervals. The plot shows that the resonance frequency was 6 Hz, with sinusoidal currents of ±6 pA (●) and 8 Hz with ±8 pA (Δ). At frequencies higher than those shown in the plot, just one or no spikes were generated, and spike frequency fell to zero. B, After 1 μm TTX perfusion, injection of sinusoidal currents at various frequencies reveals resonance in the maximum depolarization reached during the positive phase of the sinusoidal voltage response. The plot shows that the resonance frequency was 6 Hz, with sinusoidal currents of ± 6 pA (●) and 8 Hz with ±8 pA (Δ). Beyond the resonance peak, the sinusoidal voltage response decreased monotonically until 40 Hz (data not shown).
Fig. 3.
Fig. 3.
K+ dependence of slow oscillation and resonance. Current-clamp recordings were performed in the presence of 20 mm TEA, 4 mm 4-AP, and 1 mm Ni2+. A, A sustained slow oscillation is observed in granule cells recorded with K+-containing patch pipette during step current injection (10 pA from −80 mV). A solitary action potential is generated in a different cell recorded with a Cs+-containing patch pipette. In both cases, excitable responses were abolished by 1 μm TTX.B, Resonance curves in a cell recorded with K+ (●) and in another cell recorded with Cs+ (○) inside the patch pipette. Comparable voltage responses in neurons shown in A andB were obtained by properly adjusting the intensity of injected current (lower with Cs+- than with K+-containing pipettes).
Fig. 4.
Fig. 4.
Isolation of a slow K+ current,IK-slow, in the presence of 20 mm TEA, 4 mm 4-AP, 1 mmNi2+, and 1 μm TTX. A,IK-slow was generated by a voltage pulse from −80 to +30 mV. IK-slow was reversibly inhibited by application of 1 mm Ba2+.B, IK-slow activation was investigated by applying 1 sec, 10 mV depolarizing voltage steps from the holding potential of −80 mV (a short pre-step was applied to inactivate IK-A) (Bardoni and Belluzzi, 1993). The inset shows exponential fitting to the rising phase of a current recorded at 0 mV with the function I(t) =Iss * (1 - exp(−tact)), whereIss = 53 pA is the steady-state current and τ act = 33.5 msec is the activation time constant. C, IK-slowdeactivation was investigated by using voltage jumps to different potentials after a 300 msec conditioning pulse at +30 mV (holding potential = −80 mV). The inset shows exponential fitting to a tail current recorded at −10 mV with the functionI(t) =Iss + I0 * exp(−tdeact), where (Io +Iss) = 48.9 pA is the instantaneous current, Iss = 39.2 pA is the steady-state current, and τdeact = 46.9 msec is the deactivation time constant. D, Voltage dependence of steady-state amplitude of deactivation curves (Iss, ▴), and of time constants obtained by exponential fitting to activation (τact, ○) and deactivation (τdeact, ●) curves. The insetshows intersection of the linear regression curve to instantaneous tail current amplitude with the voltage axis at −71.4 mV. Data inB–D were obtained from the same granule cell.
Fig. 5.
Fig. 5.
Gating properties ofIK-slow (average data from 9 granule cells, mean ± SEM). A, AverageIV relationship (○) fitted with Equation 8 (solid line). The broken lineis the normalized steady-state activation curve (x(K-slow)) obtained with Equation 9. B, Average activation time constant (τ(K-slow)) versus membrane potential (○). The fitting line was obtained from Equation 4 and the kinetic functions shown inC. C, Voltage dependence of the kinetic constants α and β (see Eq. 3 and Table 1).
Fig. 6.
Fig. 6.
Mathematical modeling of granule cell excitability. A, Model responses to 2 pA step current injection from −80 mV. The model generates inward rectification in subthreshold responses, followed by regular repetitive firing with almost no adaptation. B, Slow oscillations, slow afterhyperpolarization, occasional uncoupling of spike prepotential from upstroke, and spike bursts can be generated by the model by using just-threshold stimulation (10.5 pA in the top andmiddle tracings, 12 pA in the bottom tracing). The shape of oscillations and bursting could be modified by changing the GNa-r orGK-slow intensities.
Fig. 7.
Fig. 7.
The oscillatory mechanism in granule cells.A, Simulation of stable oscillations sustained byGK-slow and GNa-pduring injection of an 11 pA current step. Oscillations are eliminated by turning off either GK-slow orGNa-p. All other active conductances were set to zero except GK-IR, which was used to keep input conductance close to its normal value.B, Time course and phase-plane trajectory ofIK-slow and INa-pduring membrane potential oscillations (dotted line).C, Voltage responses to an 11 pA current step simulating TEA (GK-V = 0,GK-Ca = 0), and Ni2+(GCa = 0) application. Thebroken line simulates subsequent application of TTX (GNa = 0). D, Voltage responses to an 11 pA current step simulating TEA (GK-V = 0,GK-Ca = 0) and TTX (GNa = 0) application. Same calibration in A, C, and D.
Fig. 8.
Fig. 8.
Ionic mechanisms of repetitive firing.A, Model tracings show regular firing with negligible adaptation at >100 Hz. The top plot(fI plot) reports firing frequency in control conditions (●) and after having turned offIK-A (broken line) orINa-r (dotted line). Thebottom plot shows first-spike latency in control conditions (●) and after having turned offIK-A (broken line).B, Ionic currents and [Ca2+] changes during repetitive firing. The right set oftracings is an enlargement of currents associated with an action potential. Note that both INa-pand INa-r are activated after the spike.
Fig. 9.
Fig. 9.
Ionic mechanisms of bursting. A, Tracings show intensification of bursting and spike adaptation by progressively increasing GK-Ca inhibition during injection of 11 pA current steps. StrongerGK-Ca inhibition is needed to generate bursting when GNa-r is set to zero. No bursting is generated when GNa-p andGK-slow are turned off, butGNa-r is left active. B, Ionic currents and [Ca2+] changes during bursting elicited with IK-Ca reduction to 37% of its normal value. Note that IK-slow andINa-p are greatly enhanced during bursting compared with repetitive firing.
Fig. 10.
Fig. 10.
Ionic mechanisms of resonance.A, Injection of sinusoidal currents causes oscillatory bursting in the model. Tracings are generated by a ±6 pA sinusoidal current superimposed on a 12 pA current step. Insetsshow higher spike frequency in bursts generated at 10 Hz than at 2 Hz. The plot shows model resonance with three different sinusoidal current intensities (±4, ±6, or ± 8 pA superimposed on a constant 12 pA current step). The curve generated with ±6 pA is a good match with the average experimental response (●; mean ± SD; n = 5). B, Same as in A, except that maximum membrane depolarization during the positive phase of sinusoidal voltage responses is measured with INa-f,INa-p, andINa-r set to zero. This result is compared with experimental recordings in the presence of 1 μm TTX (●; mean ± SD; n = 5, same cells as inA). As with real granule cells, the model shows resonance ∼10 Hz.
Fig. 11.
Fig. 11.
Resonance regulation. This Figure shows resonance being regulated by injection of a ±6 pA sinusoidal current superimposed on a 12 pA current step. A, Resonance in burst spike frequency in different conditions: ●, control; ■,IK-slow = 0; ⋄,GK-A = 0; Δ,GNa-p = 0; ▿,GNa-r = 0. No resonance could be observed in the model when INa-p,IK-slow, andINa-r were turned off (thin dotted line). B, Resonance in maximum membrane depolarization during the positive phase of sinusoidal voltage responses in different conditions: control (Δ,INa-p,INa-f,INa-r = 0; TTX condition); ■, IK-slow = 0, ⋄, IK-A= 0; ●, INa-p active. No resonance could be observed in the model whenINa-p,IK-slow, andINa-r were turned off (thin dotted line). C,INa-p,IK-slow, andIK-A at three different frequencies (thick line, 8 Hz; thin line, 2 Hz;broken line, 14 Hz). Note the different frequency-dependent activation of these currents.

References

    1. Adams PR, Brown DA, Constanti A. M-currents and other potassium currents in bullfrog sympathetic neurones. J Physiol (Lond) 1982a;330:537–572. - PMC - PubMed
    1. Adams PR, Brown DA, Constanti A. Pharmacological inhibition of the M-current. J Physiol (Lond) 1982b;332:223–262. - PMC - PubMed
    1. Alonso A, Llinas RR. Subthreshold Na+-dependent theta-like rhythmicity in stellate cells of entorhinal cortex layer II. Nature. 1989;342:175–177. - PubMed
    1. Armano S, Rossi P, Taglietti V, D'Angelo E. Long-term potentiation of intrinsic excitability at the mossy fiber–granule cell synapse of rat cerebellum. J Neurosci. 2000;20:5208–5216. - PMC - PubMed
    1. Azouz R, Jensen MS, Yaari Y. Ionic basis of spike after-depolarization and burst generation in adult rat hippocampal CA1 pyramidal cells. J Physiol (Lond) 1996;492:211–223. - PMC - PubMed

Publication types

MeSH terms

LinkOut - more resources