. 2001 Feb 1;21(3):961-73.
doi: 10.1523/JNEUROSCI.21-03-00961.2001.

The information content of spontaneous retinal waves

Affiliations

The information content of spontaneous retinal waves

D A Butts et al. J Neurosci. .

Abstract

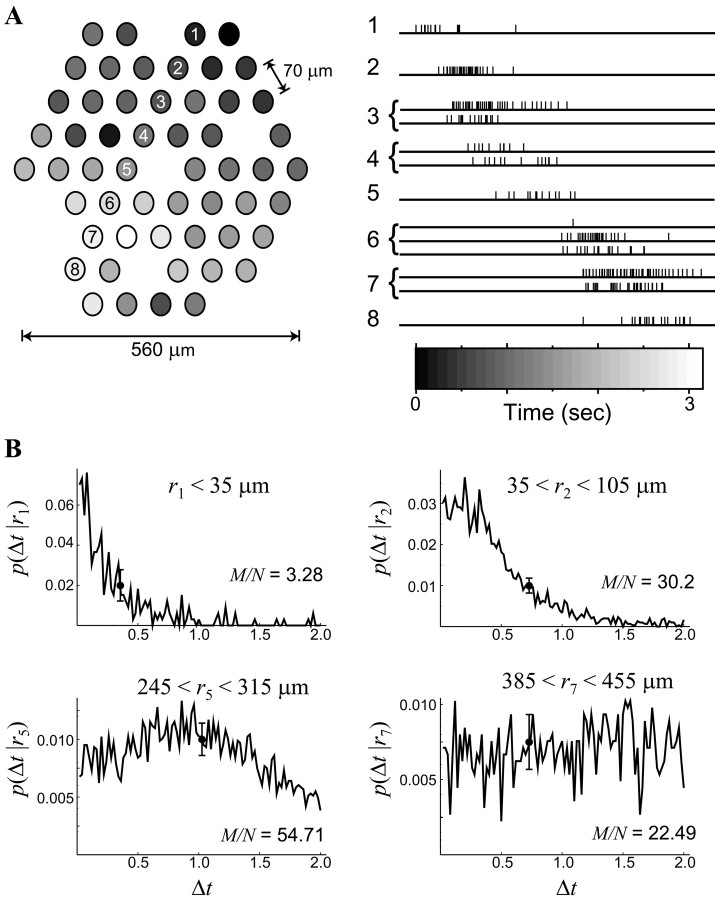
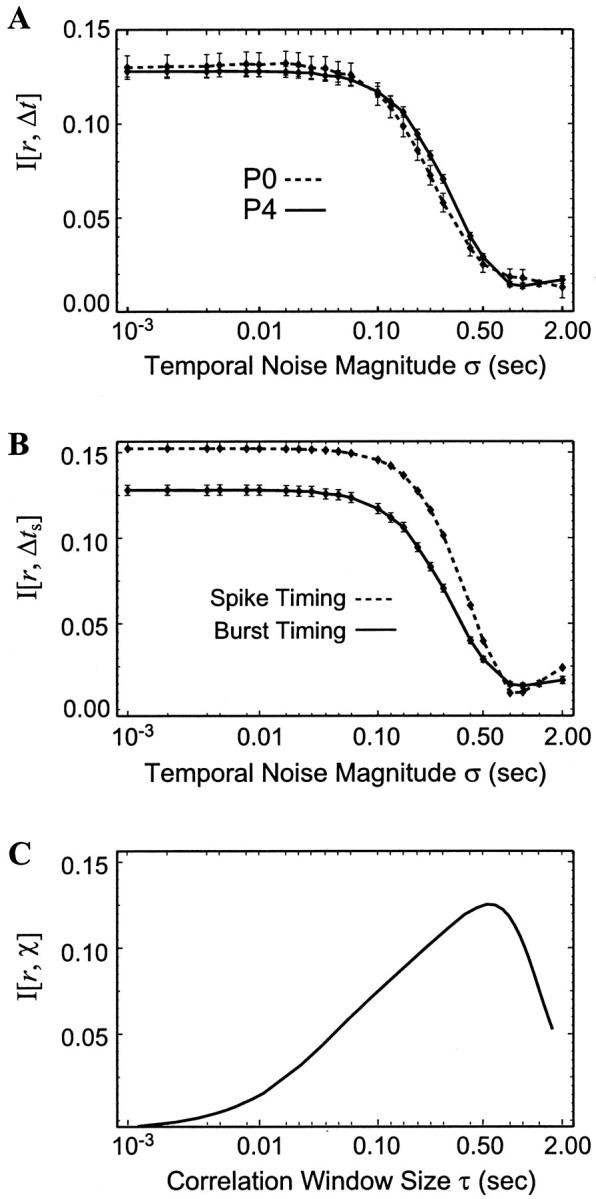
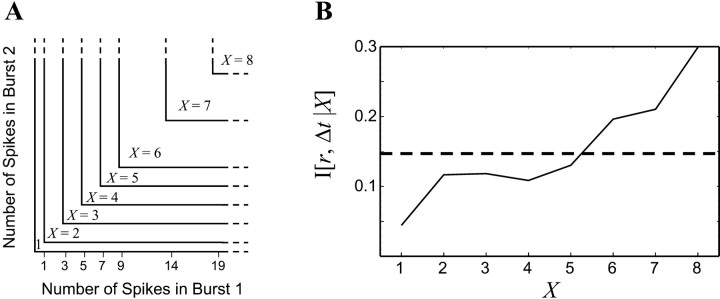
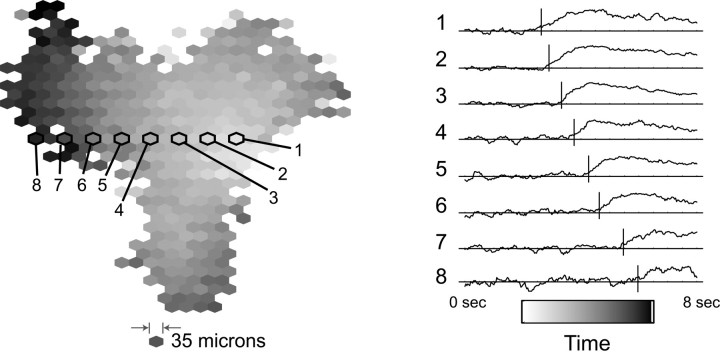
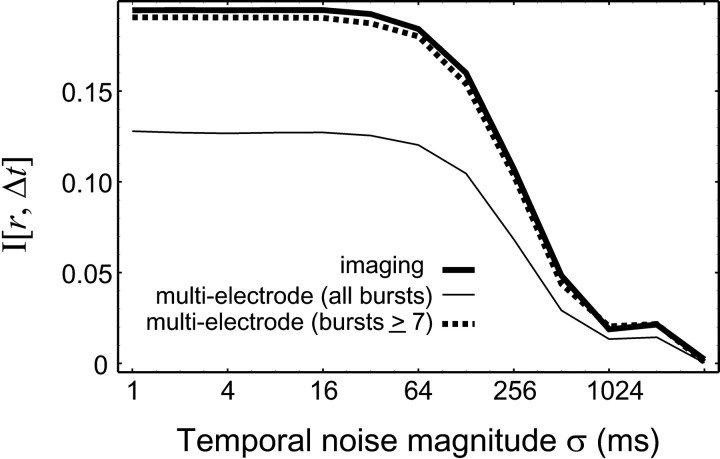
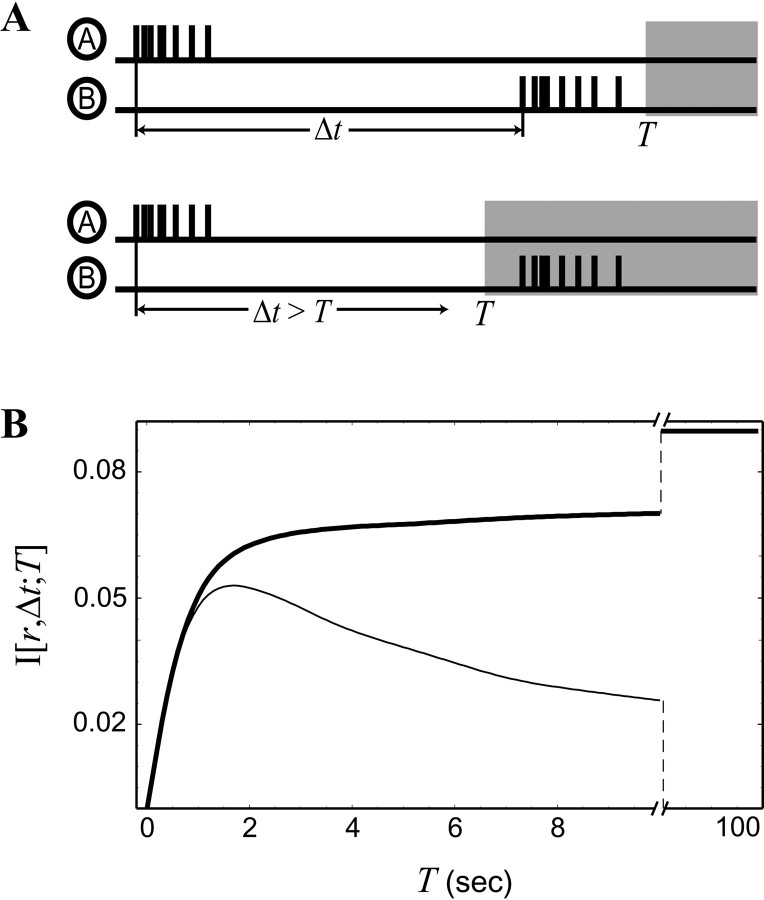
Spontaneous neural activity that is present in the mammalian retina before the onset of vision is required for the refinement of retinotopy in the lateral geniculate nucleus and superior colliculus. This paper explores the information content of this retinal activity, with the goal of determining constraints on the nature of the developmental mechanisms that use it. Through information-theoretic analysis of multielectrode and calcium-imaging experiments, we show that the spontaneous retinal activity present early in development provides information about the relative positions of retinal ganglion cells and can, in principle, be used at retinogeniculate and retinocollicular synapses to refine retinotopy. Remarkably, we find that most retinotopic information provided by retinal waves exists on relatively coarse time scales, suggesting that developmental mechanisms must be sensitive to timing differences from 100 msec up to 2 sec to make optimal use of it. In fact, a simple Hebbian-type learning rule with a correlation window on the order of seconds is able to extract the bulk of the available information. These findings are consistent with bursts of action potentials (rather than single spikes) being the unit of information used during development and suggest new experimental approaches for studying developmental plasticity of the retinogeniculate and retinocollicular synapses. More generally, these results demonstrate how the properties of neuronal systems can be inferred from the statistics of their input.


Figures

Fig. 1.
Fig. 1.
The relationship between burst onset time difference and retinotopic separation. A, Spontaneous bursting activity travels across the retinal ganglion cell layer of the developing mammalian retina. Left, The spatial locations of electrodes (numbered 1–8) that recorded from RGCs during a retinal wave are shown, with the gray scale corresponding to the relative time of burst onset (gray-scale bar, at right). Data are from P4 ferret retina (Wong et al., 1993). Right, The spike trains recorded from eight electrodes along aline (in A) are shown; burst onsets are mostly sequential. Note that an electrode often recorded from two or more cells. B, Conditional probability distributionsptr) demonstrate the likelihood that pairs of RGCs separated by a given distance will have burst onset time differences at different Δt. Data are shown for four different separations (r values). Typical error bars that result from sampling are shown, because each distribution is estimated from M total measurements divided between N total bins.
Fig. 2.
Fig. 2.
The time resolution of different measures of retinotopic information. A, Gaussian-distributed noise with SD ς was added to burst onset times of two multielectrode experiments (P0 and P4), and the mutual information between these times and retinotopic separation was calculated. B, The mutual information from the P4 experiment (solid line, also inA) was compared with the MI between retinotopic separation and spike time difference, using the same techniques of adding different magnitudes ς of Gaussian-distributed noise.C, The mutual information between retinotopic separationr and per-spike correlation index χ is shown as a function of window size τ.
Fig. 3.
Fig. 3.
The mutual information considering burst size.A, Pairs of bursts were classified into categoriesX based on the number of spikes in each burst. These categories were chosen so that approximately the same amount of pairs falls into each. B, The mutual information between retinotopic separation r and burst onset time difference Δt conditional on burst size X(solid line) is shown. The total mutual informationI[r, {Δt,X}] is shown as a dashed line.
Fig. 4.
Fig. 4.
The time evolution of a retinal wave visualized over 2 mm2 using calcium imaging. Activity occurs sequentially along the path of the wave, but the large spatial scale of the imaging experiment allows the full-wave evolution to be visualized. Left, Using low-magnification calcium imaging of a P4 ferret retina, a timing signal of the fluorescence change during a wave is determined at each point in atriangular lattice. The onset time is represented by thegray-scale level; the corresponding timing shown in abar below the traces atright. Right, The individual fluorescencetraces from eight points (with the same spacing as the multielectrode array in Fig. 1) is shown. The fluorescence level fluctuates around the average (horizontal line) until the area undergoes wave activity, leading to a higher (i.e.,darker) fluorescence value. The vertical bar shows the derived timing signal of the fluorescence change, determined using techniques described in Materials and Methods. Thevertical scale is in arbitrary units representing the brightness of the pixels of the image on videotape.
Fig. 5.
Fig. 5.
Comparison between the information content measured in two types of experiments. The information content of the calcium-imaging experiment (thick solid line) has the same time resolution as that of the multielectrode experiment (thin solid line). The mutual information between retinotopic separation r and burst onset time difference Δt is plotted for different temporal noise magnitudes. The difference in the magnitude of MI between the experiments disappears when bursts with less than seven spikes are ignored when calculating I[r, Δt] from the multielectrode data (thick dashed line).
Fig. 6.
Fig. 6.
The retinotopic information exists at course time scales. A, The observation window T is varied. For each pair of cells (cells A, B), a measurement is made for each burst of cell A.Top, If cell B bursts with its burst onset time difference Δt within T of the burst onset time of cell A, its BOTD is recorded normally. Otherwise, it is classified as Δt >T and added together with all other such measurements.Bottom, As the observation window is decreased, more and more measurements are given this classification, and information about a specific BOTD is discarded. B, The mutual information between r and Δt is calculated as a function of the observation window size T (thick line). This information I[r, Δt; T] decreases as more temporal information is discarded. The mutual information between retinotopic separation and simply whether ΔtT (coincident) or Δt >T (noncoincident), ignoring the specific value of Δt, is calculated as a function of the observation window T (thin line).

Similar articles

Cited by

References

    1. Bear MF, Malenka RC. Synaptic plasticity: LTP and LTD. Curr Opin Neurobiol. 1994;4:389–399. - PubMed
    1. Bonhoeffer T. Neurotrophins and activity-dependent development of the neocortex. Curr Opin Neurobiol. 1996;6:119–126. - PubMed
    1. Borst A, Theunissen FE. Information theory and neural coding. Nat Neurosci. 1999;2:947–957. - PubMed
    1. Butts DA, Feller MB, Shatz CJ, Rokhsar DS. Retinal waves are governed by collective network properties. J Neurosci. 1999;19:5380–5390. - PMC - PubMed
    1. Cook JE, Becker DL. Spontaneous activity as a determinant of axonal connections. Eur J Neurosci. 1990;2:162–169. - PubMed

Publication types

MeSH terms

LinkOut - more resources