Clinical Trial
. 2001 Feb 1;21(3):1033-8.
doi: 10.1523/JNEUROSCI.21-03-01033.2001.

Dopamine dependency of oscillations between subthalamic nucleus and pallidum in Parkinson's disease

Affiliations
Clinical Trial

Dopamine dependency of oscillations between subthalamic nucleus and pallidum in Parkinson's disease

P Brown et al. J Neurosci. .

Abstract

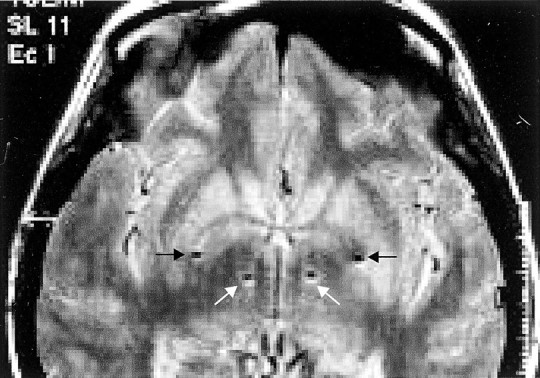
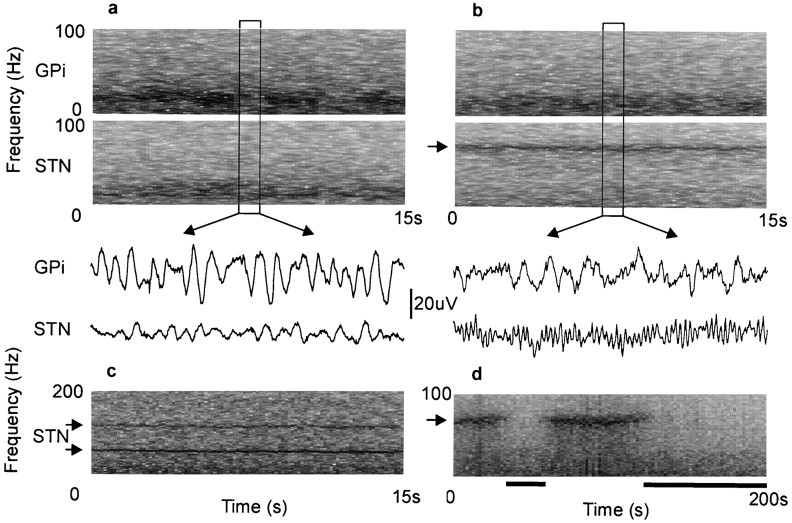
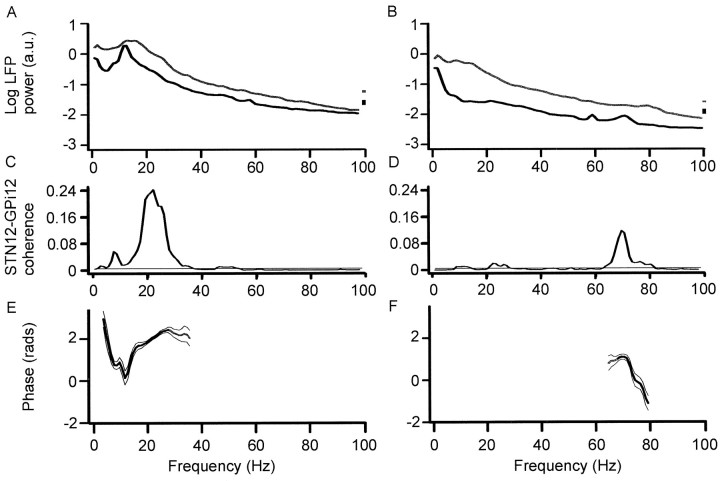
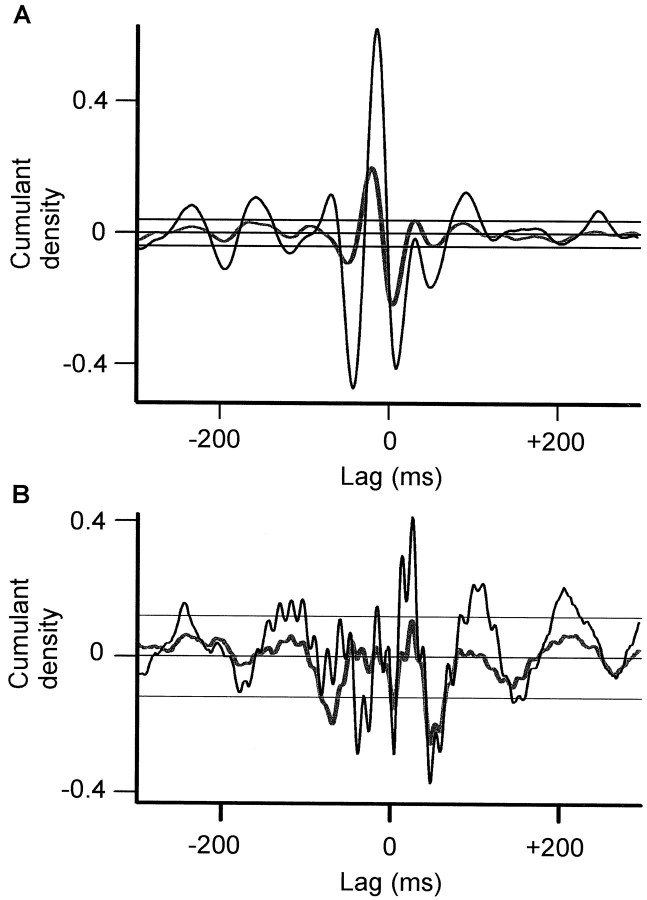
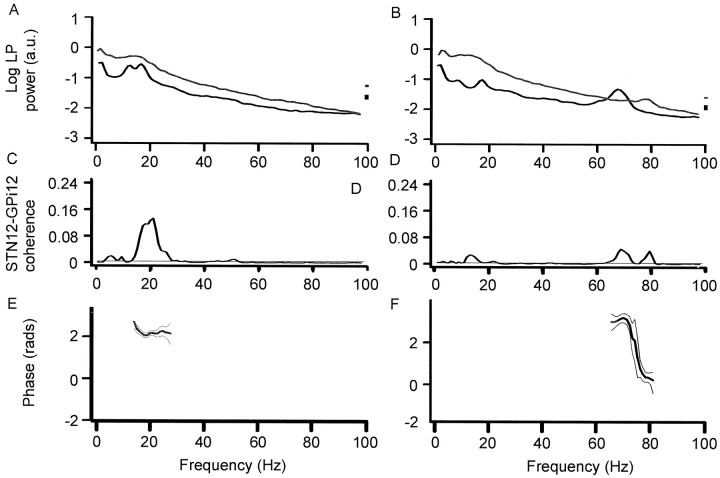
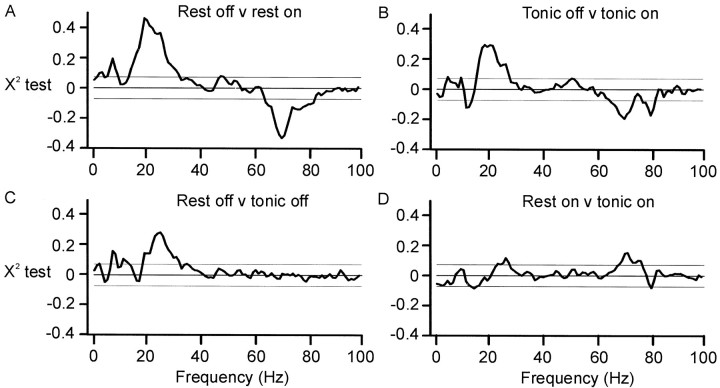
The extent of synchronization within and between the nuclei of the basal ganglia is unknown in Parkinson's disease. The question is an important one because synchronization will increase postsynaptic efficacy at subsequent projection targets. We simultaneously recorded local potentials (LPs) from the globus pallidus interna (GPi) and subthalamic nucleus (STN) in four awake patients after neurosurgery for Parkinson's disease. Nuclei from both sides were recorded in two patients so that a total of six ipsilateral GPi-STN LP recordings were made. Without medication, the power within and the coherence between the GPi and STN was dominated by activity with a frequency <30 Hz. Treatment with the dopamine precursor levodopa reduced the low-frequency activity and resulted in a new peak at approximately 70 Hz. This was evident in the power spectrum from STN and GPi and in the coherence between these nuclei. The phase relationship between the nuclei varied in a complex manner according to frequency band and the presence of exogenous dopaminergic stimulation. Synchronization of activity does occur between pallidum and STN, and its pattern is critically dependent on the level of dopaminergic activity.


Figures

Fig. 1.
Fig. 1.
T1-weighted magnetic resonance axial view in a patient with Parkinson's disease after implantation of the left then right pallidum and STN. The sites of the deepest contacts (0) are shown and lie in STN (white arrows) and GPi (black arrows), bilaterally. The scale to the right is in centimeters.
Fig. 2.
Fig. 2.
Raw LP signals picked up in GPi12 and STN12/01 at rest and variations in their frequency content over time.a, Off treatment, the records from both nuclei are dominated by activity with a frequency below 30 Hz. b, Same patient after the ingestion of levodopa. Low-frequency activity is reduced, and a sharply tuned band of activity appears in STN at ∼70 Hz (arrow). In both a andb, a 1 sec segment of corresponding LP is shown under the frequency sonograms. c, Another patient recorded on treatment, showing activity in STN at ∼70 and 140 Hz (arrows). d, A patient who fell drowsy during treatment with levodopa. The peak in activity at ∼70 Hz (arrow) is present when alert but not drowsy (denoted byblack bars and defined as eyes closed and low-voltage slow activity and α dropout in EEG).
Fig. 3.
Fig. 3.
Autospectra of LP power (A,B), coherence spectra between STN12 and GPi12 (C, D), and respective phase spectra (E, F) after withdrawal (A, C, E) or reinstitution (B, D, F) of levodopa. Data pooled from all records at rest in four patients with Parkinson's disease (over 6 experimental sessions). Off medication, there is coherence between STN12 and GPi12 at ∼6 and 20 Hz. Regression analysis of phase suggested that STN led GPi by 50 ± 19 msec from 3.9 to 11.7 Hz (r2= 0.853; p = 0.0004), whereas GPi led STN by 20 ± 5 msec from 11.7 to 27.3 Hz (r2 = 0.851;p < 0.0001). It should be noted that the 95% confidence limits for these and ensuing temporal differences were broad, although they never encompassed zero. The low-frequency activity is reduced on treatment when a peak appears at ∼70 Hz in the autospectrum of STN12 (B) and coherence spectrum (D). STN led GPi by 31 ± 6 msec (r2 = 0.928;p < 0.0001). In this and Figure 5, phase is shown in black (rather than gray) when it met criteria for measurement as defined in Materials and Methods, bin size is 0.98 Hz, and vertical bars and thin lines are 95% CL in power spectra and in coherence and phase spectra, respectively.
Fig. 4.
Fig. 4.
Cumulant density estimates after withdrawal (A) and reinstitution of levodopa (B) of levodopa recorded at rest.Black and thick gray lines are calculated from STN12–GPi12 and STN01–GPi12, respectively. STN01–GPi12 has been inverted. The close superimposition of waves indicates polarity reversal around contact 1 in STN for both the slow activity inA and fast (70 Hz) activity evident in B. The horizontal lines are the 95% CL.
Fig. 5.
Fig. 5.
Autospectra of LP power (A,B), coherence spectra between STN12 and GPi12 (C, D), and respective phase spectra (E, F) after withdrawal (A, C, E) or reinstitution (B, D, F) of levodopa. Data pooled from all records in which the contralateral wrist was tonically extended in four patients with Parkinson's disease (over 6 experimental sessions). Off medication, there is coherence between STN12 and GPi12 at ∼20 Hz. The temporal difference between STN and GPi was indeterminate, with the best-fit line accounting for only 17% of the variance. The low-frequency activity is reduced on treatment when a peak appears at ∼70 Hz in the autospectrum of STN12 (B) and coherence spectrum (D). Regression analysis of phase suggested that STN led GPi by 47 ± 9 msec from 69.3 to 82.0 Hz (r2 = 0.910;p < 0.0001).
Fig. 6.
Fig. 6.
A, Comparison of pooled coherence at rest off and on levodopa. B, Comparison of pooled coherence during tonic wrist extension off and on levodopa. In bothA and B, coherence was greater at ∼20 and 70 Hz off and on levodopa, respectively. C, Comparison of pooled coherence at rest and during tonic wrist extension when off levodopa. Coherence was greater at rest at ∼6 and 20 Hz.D, Comparison of pooled coherence at rest and during tonic wrist extension after treatment with levodopa. Coherence was greater at rest at ∼70 Hz.

References

    1. Albin RL, Young AB, Penney JB. The functional anatomy of basal ganglia disorders. Trends Neurosci. 1989;12:366–376. - PubMed
    1. Alexander GE, Crutcher ME. Functional architecture of the basal ganglia circuits: neural substrates of parallel processing. Trends Neurosci. 1990;13:266–271. - PubMed
    1. Amjad AM, Halliday DM, Rosenberg JR, Conway BA. An extended difference of coherence test for comparing and combining several independent coherence estimates: theory and application to the study of motor units and physiological tremor. J Neurosci Methods. 1997;73:69–79. - PubMed
    1. Bejjani B, Damier P, Arnulf I, Bonnet AM, Vidailhet M, Dormont D, Pidoux B, Cornu P, Marsault C, Agid Y. Pallidal stimulation for Parkinson's disease: two targets? Neurology. 1997;49:1564–1569. - PubMed
    1. Bergman H, Wichmann T, Karmon B, DeLong MR. The primate subthalamic nucleus. II. Neuronal activity in the MPTP model of parkinsonism. J Neurophysiol. 1994;72:507–520. - PubMed

Publication types

MeSH terms