

Review
doi: 10.1128/AEM.67.2.491-494.2001.
Electrophoretic mobility distributions of single-strain microbial populations
Affiliations
- PMID: 11157207
- PMCID: PMC92611
- DOI: 10.1128/AEM.67.2.491-494.2001
Item in Clipboard
Review
Electrophoretic mobility distributions of single-strain microbial populations
Appl Environ Microbiol.
2001 Feb.
No abstract available
Figures
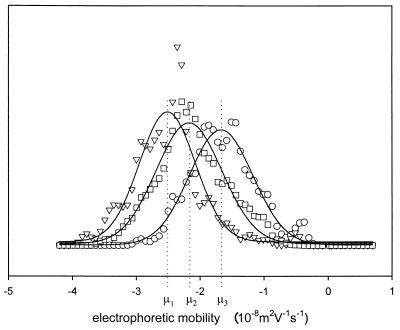
Electrophoretic mobility distributions of E. coli Hu734 organisms suspended in 10 mM potassium phosphate (pH 6.3). The three distributions (μ1, μ2, and μ3) were measured on separately cultured bacterial strains, and each has its own SDpopulation. Typically, the μmean of μ1, μ2, and μ3 is presented in the literature as an electrophoretic mobility of −2.1 (±0.7) × 10−8 m2 V−1 s−1, with a standard deviation, SDcultures, from the three measurements.
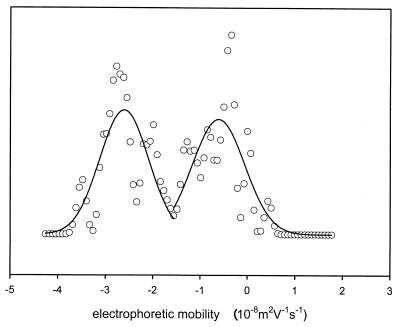
Bimodal electrophoretic mobility distribution of Pseudomonas aeruginosa #3, suspended in phosphate-buffered saline (pH 7.0).
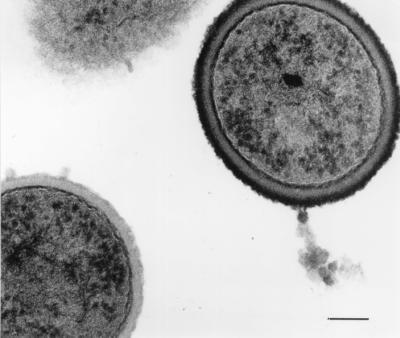
Electron micrograph of ruthenium red-uranyl acetate-stained (12) L. acidophilus RC14 cells after being subcultured 20 times. Individual organisms with a thick stainable layer as their outermost cell surface can be observed next to organisms devoid of a stainable layer (micrograph reprinted from the Journal of Microbiological Methods [9] with permission from Elsevier Science). The bar denotes 0.15 μm.
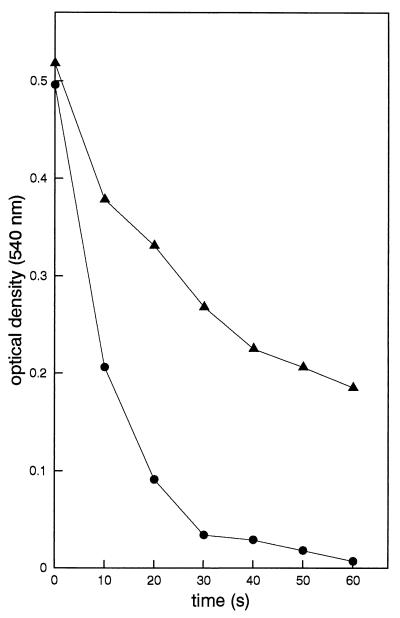
Optical densities as a function of vortexing time for S. salivarius HB (●) and S. oralis J22 (▴) in MATH analysis. Hexadecane was used as the hydrocarbon phase, while bacteria were suspended in 10 mM potassium phosphate, pH 5.0. Note that for S. salivarius HB, the optical density is reduced essentially to zero but that for S. oralis J22, a sizeable optical density remains, also after prolonged vortexing.
Similar articles
-
Significance of electrophoretic mobility distribution to bacterial transport in granular porous media.J Microbiol Methods. 2002 Sep;51(1):83-93. doi: 10.1016/s0167-7012(02)00062-3. J Microbiol Methods. 2002. PMID: 12069893
-
The effect of ionic strength on the electrophoretic mobility and protonation constants of an EPS-producing bacterial strain.J Colloid Interface Sci. 2010 Aug 15;348(2):348-54. doi: 10.1016/j.jcis.2010.04.082. Epub 2010 May 23. J Colloid Interface Sci. 2010. PMID: 20546767
-
Homeland security and bioterrorism applications: detection of bioweapon pathogens by microfluidic-based electrophoretic DNA analysis.MLO Med Lab Obs. 2004 Feb;36(2):34-8. MLO Med Lab Obs. 2004. PMID: 15002151 No abstract available.
-
[Implication of viable but nonculturable (VNC) concept].Nihon Rinsho. 2007 Feb 28;65 Suppl 2 Pt. 1:674-8. Nihon Rinsho. 2007. PMID: 17455703 Review. Japanese. No abstract available.
-
Physical methods for characterization of microbial surfaces.Experientia. 1989 Dec 1;45(11-12):1047-55. doi: 10.1007/BF01950157. Experientia. 1989. PMID: 2689202 Review.
Cited by
-
Specific molecular recognition and nonspecific contributions to bacterial interaction forces.Appl Environ Microbiol. 2008 May;74(9):2559-64. doi: 10.1128/AEM.02839-07. Epub 2008 Mar 14. Appl Environ Microbiol. 2008. PMID: 18344352 Free PMC article. Review. No abstract available.
-
Influence of surface characteristics on the stability of Cryptosporidium parvum oocysts.Appl Environ Microbiol. 2003 Jul;69(7):3819-25. doi: 10.1128/AEM.69.7.3819-3825.2003. Appl Environ Microbiol. 2003. PMID: 12839749 Free PMC article.
-
The cell wall of lactic acid bacteria: surface constituents and macromolecular conformations.Biophys J. 2003 Dec;85(6):4076-92. doi: 10.1016/S0006-3495(03)74820-6. Biophys J. 2003. PMID: 14645095 Free PMC article.
-
Influence of culture heterogeneity in cell surface charge on adhesion and biofilm formation by Enterococcus faecalis.J Bacteriol. 2006 Apr;188(7):2421-6. doi: 10.1128/JB.188.7.2421-2426.2006. J Bacteriol. 2006. PMID: 16547028 Free PMC article.
-
Enhancing transport of hydrogenophaga flava ENV735 for bioaugmentation of aquifers contaminated with methyl tert-butyl ether.Appl Environ Microbiol. 2002 Nov;68(11):5571-9. doi: 10.1128/AEM.68.11.5571-5579.2002. Appl Environ Microbiol. 2002. PMID: 12406751 Free PMC article.
References
-
- Bos R, van der Mei H C, Busscher H J. Physico-chemistry of initial microbial adhesive interactions—its mechanisms and methods for study. FEMS Microbiol Rev. 1999;23:179–229. - PubMed
-
- Busscher H J, Bellon-Fontaine M N, Mozes N, van der Mei H C, Sjollema J, Cerf O, Rouxhet P G. Deposition of Leuconostoc mesenteroides and Streptococcus thermophilus to solid substrata in a parallel plate flow cell. Biofouling. 1990;2:55–63.
-
- Busscher H J, van de Belt-Gritter B, van der Mei H C. Implications of microbial adhesion to hydrocarbons for evaluating cell surface hydrophobicity. 1. Zeta potentials of hydrocarbon droplets. Colloids Surf B. 1995;5:111–116.
-
- Busscher H J, Bos R, van der Mei H C, Handley P S. Physicochemistry of microbiol adhesion from an overall approach to the limits. In: Baszkin A, Norde W, editors. Physical chemistry of biological surfaces. New York, N.Y: Marcel Dekker; 2000. pp. 431–458.
-
- Cowan M M, van der Mei H C, Stokroos I, Busscher H J. Heterogeneity of surfaces of subgingival bacteria as detected by zeta potential measurements. J Dent Res. 1992;71:1803–1806. - PubMed
Publication types
MeSH terms
Substances
LinkOut - more resources
Full Text Sources
Molecular Biology Databases
