. 2001 Feb;67(2):702-12.
doi: 10.1128/AEM.67.2.702-712.2001.

Impact of dilution on microbial community structure and functional potential: comparison of numerical simulations and batch culture experiments

Collaborators, Affiliations

Impact of dilution on microbial community structure and functional potential: comparison of numerical simulations and batch culture experiments

R B Franklin et al. Appl Environ Microbiol. 2001 Feb.

Abstract

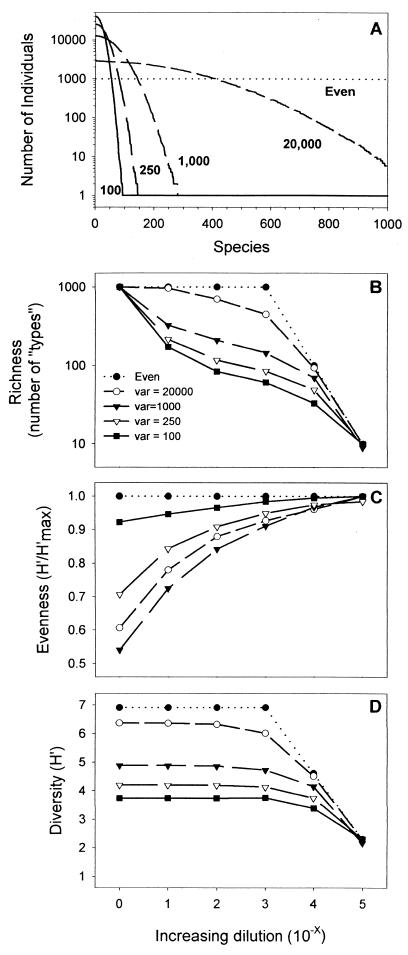
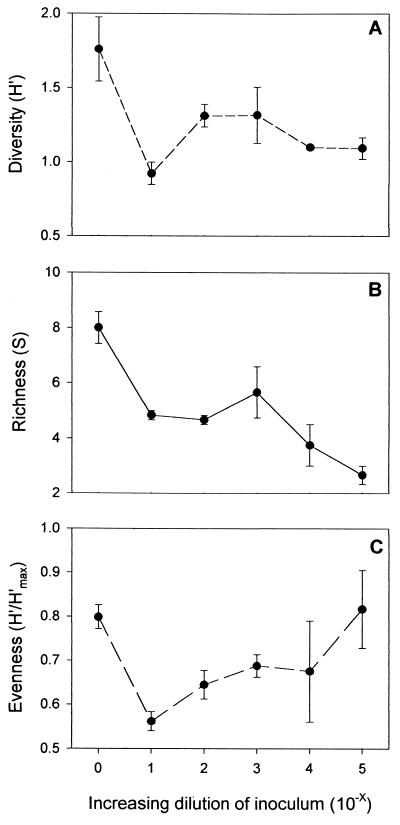
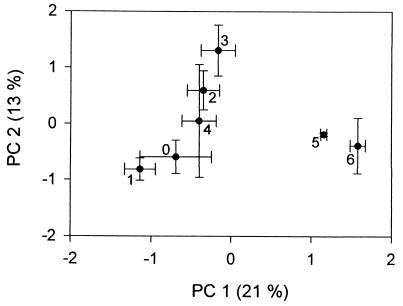
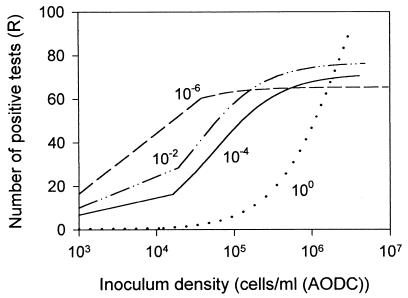
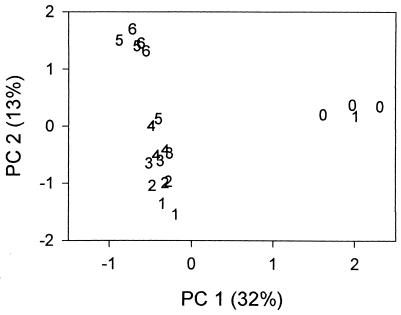
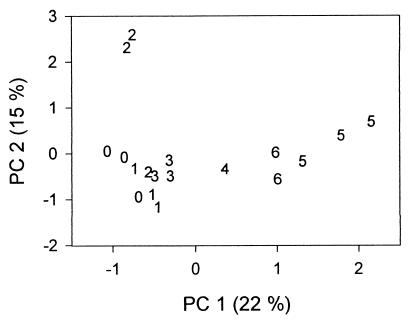
A series of microcosm experiments was performed using serial dilutions of a sewage microbial community to inoculate a set of batch cultures in sterile sewage. After inoculation, the dilution-defined communities were allowed to regrow for several days and a number of community attributes were measured in the regrown assemblages. Based upon a set of numerical simulations, community structure was expected to differ along the dilution gradient; the greatest differences in structure were anticipated between the undiluted-low-dilution communities and the communities regrown from the very dilute (more than 10(-4)) inocula. Furthermore, some differences were expected among the lower-dilution treatments (e.g., between undiluted and 10(-1)) depending upon the evenness of the original community. In general, each of the procedures used to examine the experimental community structures separated the communities into at least two, often three, distinct groups. The groupings were consistent with the simulated dilution of a mixture of organisms with a very uneven distribution. Significant differences in community structure were detected with genetic (amplified fragment length polymorphism and terminal restriction fragment length polymorphism), physiological (community level physiological profiling), and culture-based (colony morphology on R2A agar) measurements. Along with differences in community structure, differences in community size (acridine orange direct counting), composition (ratio of sewage medium counts to R2A counts, monitoring of each colony morphology across the treatments), and metabolic redundancy (i.e., generalist versus specialist) were also observed, suggesting that the differences in structure and diversity of communities maintained in the same environment can be manifested as differences in community organization and function.


Figures

FIG. 1
FIG. 1
(A) Distribution of individuals among 1,000 types in the initial communities used in simulations. Note that both total abundance and richness were the same in each of the five communities. The mean of each distribution was set at 500, and the variance was altered to simulate communities with a dominant (var = 100, 250, or 1,000) or relatively even (var = 20,000 or even) distribution. (B to D) Simulation results showing how community structure differed in the various initial communities for each serial dilution. The x axis represents the negative exponent of the dilution factor (e.g., 4 corresponds to a 10−4 dilution), and the y axis represents richness (number of types or species) (B), evenness (C), or the calculated value of the Shannon-Wiener diversity index (D).
FIG. 2
FIG. 2
Results of R2A colony morphology comparison. All values are reported as the average per R2A plate ± 1 standard error. Each value was calculated by comparing 25 randomly selected colonies on each plate, using two replicate plates per flask and three flasks for each treatment. The sole exception to this was the 10−4 treatment, where only two of the replicate flasks were compared. The x axis in each of these graphs represents the negative exponent of the dilution factor used to create the original inoculum (e.g., 4 corresponds to a 10−4 dilution). The y axis represents diversity of colony morphologies based upon the Shannon-Wiener diversity index (A), richness (the number of distinct colony morphotypes) (B), or evenness (C).
FIG. 3
FIG. 3
Results of PCA of the CLPP data. Each point represents the average for three replicate flasks maintained at each dilution; error bars represent ± 1 standard error. Each treatment is identified by the negative exponent of the dilution factor used to create the original inoculum (e.g., 4 corresponds to a 10−4 dilution). The percentage of variance explained by each PC is provided.
FIG. 4
FIG. 4
Results of dilution-extinction analysis of CLPP for each regrown community. The x axis represents the inoculum density (as measured by AODC) used in each CLPP assay (presented on a log10 scale). The y axis is the number of positive tests for each incubation. The results are presented as fitted lines generated by modeling the untransformed data with a right rectangular hyperbola; the associated regression statistics for this fit are given in Table 2. The curvature of the regression lines at lower inoculum levels is an artifact of the log scaling of the x axis.
FIG. 5
FIG. 5
Results of PCA of the AFLP profiles. Data are presented for each of three replicate flasks for each treatment, and each value corresponds to the negative exponent of the dilution factor used to create the original inoculum (e.g., 4 corresponds to a 10−4 dilution). The percent variance explained by each PC is provided.
FIG. 6
FIG. 6
Results of PCA of T-RFLP profiles. Data are presented for each of three replicate flasks for each treatment, and each value corresponds to the negative exponent of the dilution factor used to create the original inoculum (e.g., 4 corresponds to a 10−4 dilution). Due to experimental difficulties with the T-RFLP analysis, only one of the flasks from the 10−4 dilution community and only two of the flasks from the 10−6 dilution community were analyzed. The percent variance explained by each PC is provided.

References

    1. Bej A K, Mahbubani M H. Applications of the polymerase chain reaction (PCR) in vitro DNA-amplification method in environmental microbiology. In: Griffin H G, Griffin A M, editors. PCR technology: current innovations. Boca Raton, Fla: CRC Press, Inc.; 1994. pp. 327–339.
    1. Brunk C F, Avaniss-Aghajani E, Brunk C A. A computer analysis of primer and probe hybridization potential with bacterial small-subunit rRNA sequences. Appl Environ Microbiol. 1996;62:872–879. - PMC - PubMed
    1. Busse H-J, Denner E B M, Lubitz W. Classification and identification of bacteria: current approaches to an old problem. Overview of methods used in bacterial systematics. J Biotechnol. 1996;47:3–38. - PubMed
    1. Chapin F S, Walker B H, Hobbs R J, Hooper D U, Lawton J H, Sala O E, Tilman D. Biotic control over the functioning of ecosystems. Science. 1997;277:500–503.
    1. Dunbar J, Ticknor L O, Kuske C R. Assessment of microbial diversity in four southwestern United States soils by 16S rRNA gene terminal restriction fragment analysis. Appl Environ Microbiol. 2000;66:2943–2950. - PMC - PubMed

Publication types

LinkOut - more resources