

Pseudomonas stutzeri nitrite reductase gene abundance in environmental samples measured by real-time PCR
- PMID: 11157241
- PMCID: PMC92645
- DOI: 10.1128/AEM.67.2.760-768.2001
Pseudomonas stutzeri nitrite reductase gene abundance in environmental samples measured by real-time PCR
Abstract
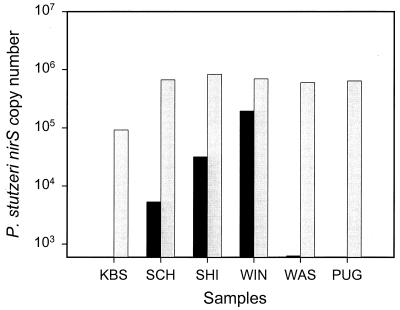
We used real-time PCR to quantify the denitrifying nitrite reductase gene (nirS), a functional gene of biogeochemical significance. The assay was tested in vitro and applied to environmental samples. The primer-probe set selected was specific for nirS sequences that corresponded approximately to the Pseudomonas stutzeri species. The assay was linear from 1 to 10(6) gene copies (r2 = 0.999). Variability at low gene concentrations did not allow detection of twofold differences in gene copy number at less than 100 copies. DNA spiking and cell-addition experiments gave predicted results, suggesting that this assay provides an accurate measure of P. stutzeri nirS abundance in environmental samples. Although P. stutzeri abundance was high in lake sediment and groundwater samples, we detected low or no abundance of this species in marine sediment samples from Puget Sound (Wash.) and from the Washington ocean margin. These results suggest that P. stutzeri may not be a dominant marine denitrifier.
Figures
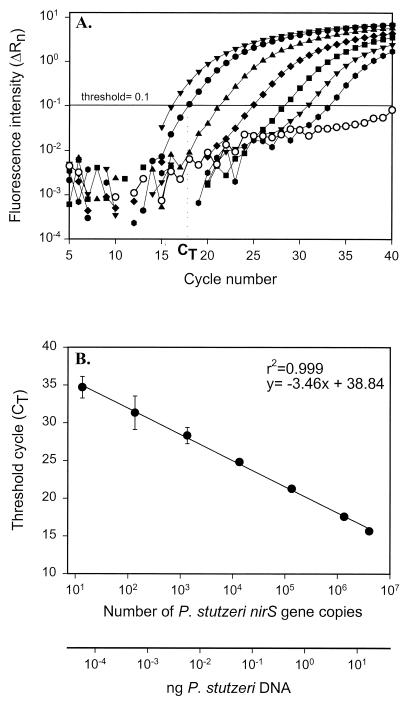
 , 59 fg; ○, no-template control. CT, cycle at which the fluorescence intensity crosses an arbitrary threshold value. (B) Standard curve. Values represent means ± 95% confidence interval (n = 3).

Similar articles
-
Nitrite reductase genes (nirK and nirS) as functional markers to investigate diversity of denitrifying bacteria in pacific northwest marine sediment communities.Appl Environ Microbiol. 2000 May;66(5):2096-104. doi: 10.1128/AEM.66.5.2096-2104.2000. Appl Environ Microbiol. 2000. PMID: 10788387 Free PMC article.
-
Antibody and DNA probes for detection of nitrite reductase in seawater.J Gen Microbiol. 1993 Sep;139(9):2285-93. doi: 10.1099/00221287-139-9-2285. J Gen Microbiol. 1993. PMID: 8245846
-
Copper-containing nitrite reductase from Pseudomonas aureofaciens is functional in a mutationally cytochrome cd1-free background (NirS-) of Pseudomonas stutzeri.Arch Microbiol. 1993;160(1):18-26. doi: 10.1007/BF00258141. Arch Microbiol. 1993. PMID: 8352648
-
Presence of two different active nirS nitrite reductase genes in a denitrifying Thauera sp. from a high-nitrate-removal-rate reactor.Appl Environ Microbiol. 2005 Sep;71(9):5642-5. doi: 10.1128/AEM.71.9.5642-5645.2005. Appl Environ Microbiol. 2005. PMID: 16151169 Free PMC article.
-
Detection and quantification of copper-denitrifying bacteria by quantitative competitive PCR.J Microbiol Methods. 2004 Nov;59(2):199-210. doi: 10.1016/j.mimet.2004.07.008. J Microbiol Methods. 2004. PMID: 15369856
Cited by
-
Detection and diversity of expressed denitrification genes in estuarine sediments after reverse transcription-PCR amplification from mRNA.Appl Environ Microbiol. 2002 Oct;68(10):5017-25. doi: 10.1128/AEM.68.10.5017-5025.2002. Appl Environ Microbiol. 2002. PMID: 12324352 Free PMC article.
-
Characterization of microbial activities and U reduction in a shallow aquifer contaminated by uranium mill tailings.Microb Ecol. 2003 Jul;46(1):83-91. doi: 10.1007/s00248-002-1060-x. Epub 2003 May 21. Microb Ecol. 2003. PMID: 12754659
-
In situ expression of nifD in Geobacteraceae in subsurface sediments.Appl Environ Microbiol. 2004 Dec;70(12):7251-9. doi: 10.1128/AEM.70.12.7251-7259.2004. Appl Environ Microbiol. 2004. PMID: 15574924 Free PMC article.
-
Carbon amendment and soil depth affect the distribution and abundance of denitrifiers in agricultural soils.Environ Sci Pollut Res Int. 2016 Apr;23(8):7899-910. doi: 10.1007/s11356-015-6030-1. Epub 2016 Jan 14. Environ Sci Pollut Res Int. 2016. PMID: 26762934
-
Denitrification likely catalyzed by endobionts in an allogromiid foraminifer.ISME J. 2012 May;6(5):951-60. doi: 10.1038/ismej.2011.171. Epub 2011 Dec 1. ISME J. 2012. PMID: 22134648 Free PMC article.
References
-
- Asuming-Brempong S. The effect of 2,4-dichlorophenoxyacetate selection on microbial communities in microcosm and field studies and the impact on ecosystem function. Ph.D. thesis. East Lansing: Michigan State University; 1999.
-
- Bièche I, Laurendeau I, Tozlu S, Olivi M, Vidaud D, Lidereau R, Vidaud M. Quantitation of MYC gene expression in sporadic breast tumors with a real-time reverse transcription-PCR assay. Cancer Res. 1999;59:2759–2765. - PubMed
-
- Bièche I, Olivi M, Champème M-H, Vidaud D, Lidereau R, Vidaud M. Novel approach to quantitative polymerase chain reaction using real-time detection: application to the detection of gene amplification in breast cancer. Int J Cancer. 1998;78:661–666. - PubMed
-
- Blattner F R, Plunkett III G, Bloch C A, Perna N T, Burland V, Riley M, Collado-Vides J, Glasner J D, Rode C K, Mayhew G F, Gregor J, Davis N W, Kirkpatrick H A, Goeden M A, Rose D J, Mau B, Shao Y. The complete genome sequence of Escherichia coli K-12. Science. 1997;277:1453–1474. - PubMed
-
- Bloem J. Fluorescent staining of microbes for total direct counts. In: Akkermans A D L, van Elsas J D, de Brujin F J, editors. Molecular microbial ecology manual. Dordrecht, The Netherlands: Kluwer Academic Publishers; 1995. pp. 1–12.
Publication types
MeSH terms
Substances
LinkOut - more resources
Full Text Sources
Molecular Biology Databases
