

The large-scale organization of the centromeric region in Beta species
- PMID: 11157788
- PMCID: PMC311043
- DOI: 10.1101/gr.162301
The large-scale organization of the centromeric region in Beta species
Abstract
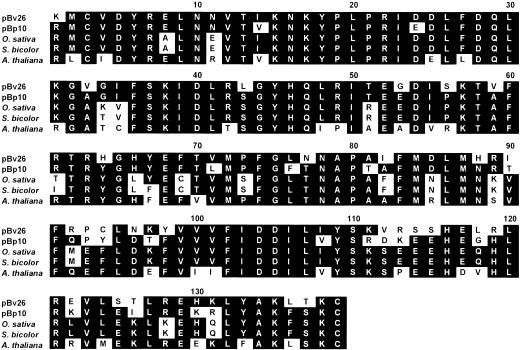
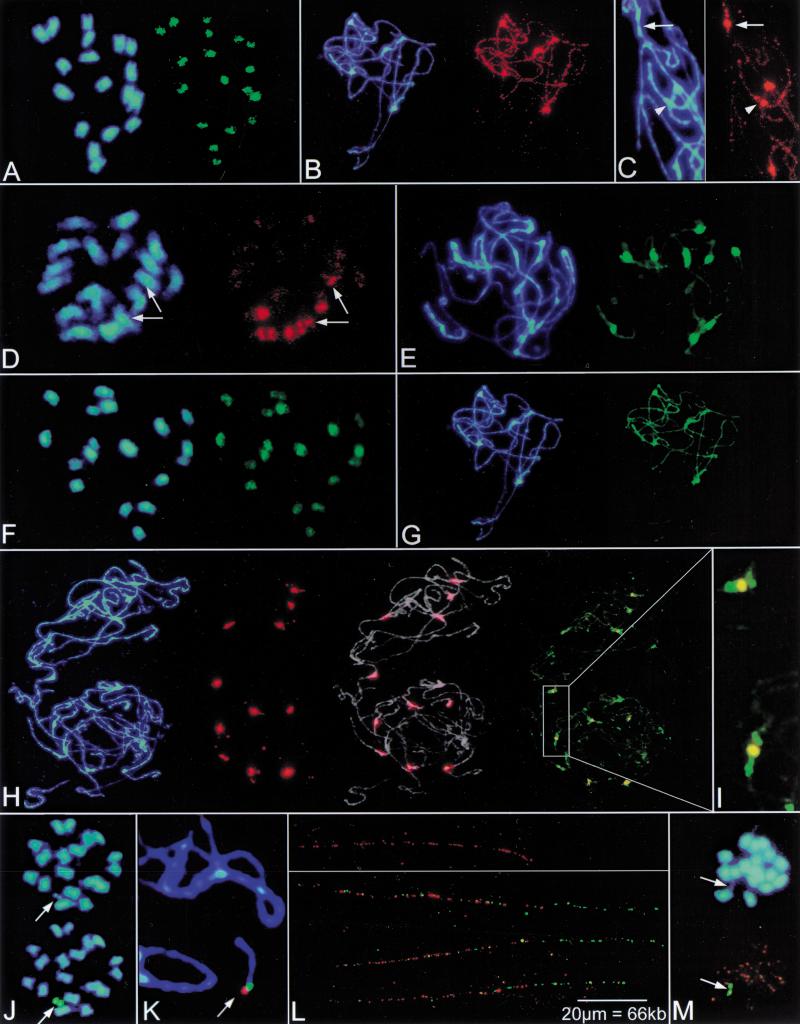
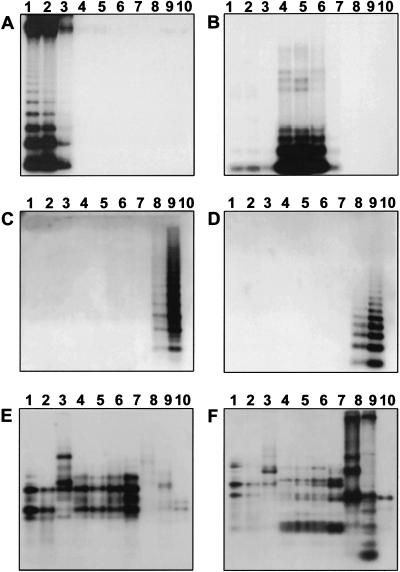
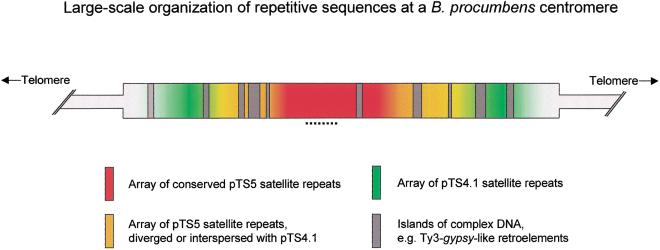
In higher eukaryotes, the DNA composition of centromeres displays a high degree of variation, even between chromosomes of a single species. However, the long-range organization of centromeric DNA apparently follows similar structural rules. In our study, a comparative analysis of the DNA at centromeric regions of Beta species, including cultivated and wild beets, was performed using a set of repetitive DNA sequences. Our results show that these regions in Beta genomes have a complex structure and consist of variable repetitive sequences, including satellite DNA, Ty3-gypsy-like retrotransposons, and microsatellites. Based on their molecular characterization and chromosomal distribution determined by fluorescent in situ hybridization (FISH), centromeric repeated DNA sequences were grouped into three classes. By high-resolution multicolor-FISH on pachytene chromosomes and extended DNA fibers we analyzed the long-range organization of centromeric DNA sequences, leading to a structural model of a centromeric region of the wild beet species Beta procumbens. The chromosomal mutants PRO1 and PAT2 contain a single wild beet minichromosome with centromere activity and provide, together with cloned centromeric DNA sequences, an experimental system toward the molecular isolation of individual plant centromeres. In particular, FISH to extended DNA fibers of the PRO1 minichromosome and pulsed-field gel electrophoresis of large restriction fragments enabled estimations of the array size, interspersion patterns, and higher order organization of these centromere-associated satellite families. Regarding the overall structure, Beta centromeric regions show similarities to their counterparts in the few animal and plant species in which centromeres have been analyzed in detail.
Figures
Similar articles
-
A BAC library of Beta vulgaris L. for the targeted isolation of centromeric DNA and molecular cytogenetics of Beta species.Genetica. 2009 Mar;135(2):157-67. doi: 10.1007/s10709-008-9265-7. Epub 2008 Apr 4. Genetica. 2009. PMID: 18386131
-
Divergence of satellite DNA and interspersion of dispersed repeats in the genome of the wild beet Beta procumbens.Chromosome Res. 2003;11(1):3-21. doi: 10.1023/a:1022005514470. Chromosome Res. 2003. PMID: 12675302
-
Diversity of a complex centromeric satellite and molecular characterization of dispersed sequence families in sugar beet (Beta vulgaris).Ann Bot. 2008 Oct;102(4):521-30. doi: 10.1093/aob/mcn131. Epub 2008 Aug 5. Ann Bot. 2008. PMID: 18682437 Free PMC article.
-
[Advances in research of the structure and function of plant centromeres].Yi Chuan. 2006 Dec;28(12):1597-606. doi: 10.1360/yc-006-1597. Yi Chuan. 2006. PMID: 17138549 Review. Chinese.
-
Organization and evolution of highly repeated satellite DNA sequences in plant chromosomes.Cytogenet Genome Res. 2005;109(1-3):15-26. doi: 10.1159/000082377. Cytogenet Genome Res. 2005. PMID: 15753554 Review.
Cited by
-
Molecular cytogenetic characterization of the Antirrhinum majus genome.Genetics. 2005 Jan;169(1):325-35. doi: 10.1534/genetics.104.031146. Epub 2004 Sep 15. Genetics. 2005. PMID: 15371361 Free PMC article.
-
Preparing high-quality chromosome spreads from Crocus species for karyotyping and FISH.Mol Cytogenet. 2025 Feb 20;18(1):2. doi: 10.1186/s13039-025-00706-7. Mol Cytogenet. 2025. PMID: 39980057 Free PMC article.
-
The Ty1-copia families SALIRE and Cotzilla populating the Beta vulgaris genome show remarkable differences in abundance, chromosomal distribution, and age.Chromosome Res. 2010 Feb;18(2):247-63. doi: 10.1007/s10577-009-9104-4. Epub 2009 Dec 29. Chromosome Res. 2010. PMID: 20039119
-
Sequence organization of barley centromeres.Nucleic Acids Res. 2001 Dec 15;29(24):5029-35. doi: 10.1093/nar/29.24.5029. Nucleic Acids Res. 2001. PMID: 11812833 Free PMC article.
-
Resolution of fluorescence in-situ hybridization mapping on rice mitotic prometaphase chromosomes, meiotic pachytene chromosomes and extended DNA fibers.Chromosome Res. 2002;10(5):379-87. doi: 10.1023/a:1016849618707. Chromosome Res. 2002. PMID: 12296520
References
-
- Aragon-Alcaide L, Miller T, Schwarzacher T, Reader S, Moore G. A cereal centromere sequence. Chromosoma. 1996;105:261–268. - PubMed
-
- Arumuganathan K, Earle ED. Nuclear DNA content of some important plant species. Plant Mol Biol Rep. 1991;9:208–218.
-
- Brandes A. “Erstellung und Charakterisierung von nematodenresistenten Additions- und Translokationslinien bei B. vulgaris L.” Ph.D. thesis. Germany: University of Hannover; 1992.
Publication types
MeSH terms
Associated data
- Actions
- Actions
- Actions
LinkOut - more resources
Full Text Sources
Other Literature Sources