Comparative Study
. 2001 Feb;11(2):290-9.
doi: 10.1101/gr.154101.

Efficiency of database search for identification of mutated and modified proteins via mass spectrometry

Affiliations
Comparative Study

Efficiency of database search for identification of mutated and modified proteins via mass spectrometry

P A Pevzner et al. Genome Res. 2001 Feb.

Abstract

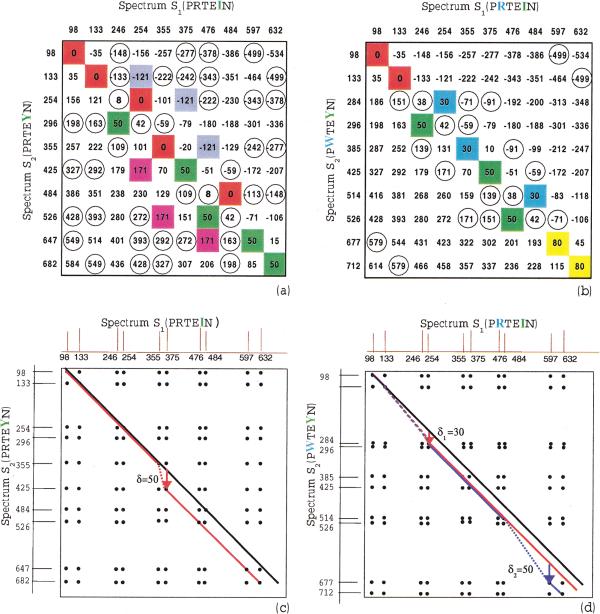
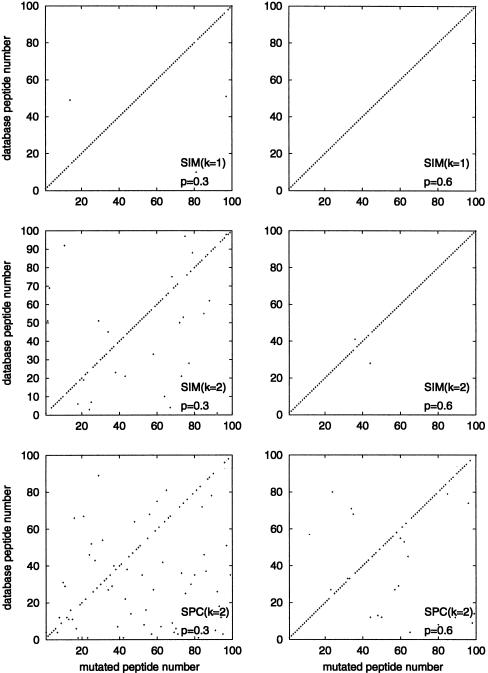
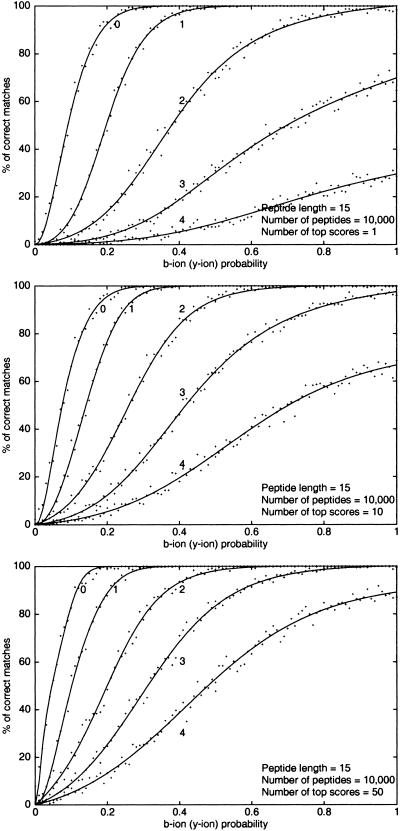
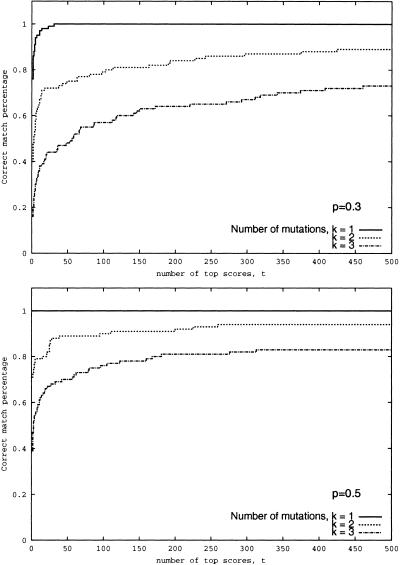
Although protein identification by matching tandem mass spectra (MS/MS) against protein databases is a widespread tool in mass spectrometry, the question about reliability of such searches remains open. Absence of rigorous significance scores in MS/MS database search makes it difficult to discard random database hits and may lead to erroneous protein identification, particularly in the case of mutated or post-translationally modified peptides. This problem is especially important for high-throughput MS/MS projects when the possibility of expert analysis is limited. Thus, algorithms that sort out reliable database hits from unreliable ones and identify mutated and modified peptides are sought. Most MS/MS database search algorithms rely on variations of the Shared Peaks Count approach that scores pairs of spectra by the peaks (masses) they have in common. Although this approach proved to be useful, it has a high error rate in identification of mutated and modified peptides. We describe new MS/MS database search tools, MS-CONVOLUTION and MS-ALIGNMENT, which implement the spectral convolution and spectral alignment approaches to peptide identification. We further analyze these approaches to identification of modified peptides and demonstrate their advantages over the Shared Peaks Count. We also use the spectral alignment approach as a filter in a new database search algorithm that reliably identifies peptides differing by up to two mutations/modifications from a peptide in a database.


Figures

Figure 1
Figure 1
Theoretical spectra of peptides PRTEIN, PRTEYN (one mutation), and PWTEYN (two mutations), representing masses of all b- and y-ions in the corresponding peptides. Shared masses between spectra of mutated peptides and the original spectrum (p = 1) are indicated by dashed lines.
Figure 2
Figure 2
(a) Elements of the spectral convolution S2 ⊖ S1 represented as elements of a difference matrix. (S1 and S2 are theoretical spectra of peptides PRTEIN and PRTEYN, correspondingly, differing by a single mutation). The elements with multiplicity >2 are shown in color, and the elements with multiplicity equal to 2 are shown in circles. The high multiplicity element 0 (red) corresponds to shared masses between these spectra, while another high multiplicity element 50 (green) corresponds to the shift of masses by δ = 50 due to mutation I → Y in PRTEIN (the mass of I is 113, and the mass of Y is 163). The SPC takes into account only the red entries in this matrix while the spectral convolution (for k = 1) takes into account both red and green entries, thus providing better peptide identification. (b) Same as a for the case of two mutations in peptide PRTEIN : R → W with δ1 = 30 and I → Y with δ2 = 50 (the mass of R is 156, and the mass of W is 186). Again, SPC takes into account only red entries. (c, d) Spectral alignment. Black lines represent the paths for k = 0 with similarity score (D(0) = 5 in c, and D(0) = 2 in d); red lines represent the paths for k = 1 (D(1) = 8 in c, and D(1) = 5 in d); blue line in d represents the path for k = 2 (D(2) = 7). The Shared Peaks Count reveals only D(0) matching peaks on the main diagonal, while spectral alignment reveals more hidden similarities between spectra and detects the corresponding mutations. Mutations/modifications are detected by jumps between the diagonals, for example,. spectral alignment with k = 1 detects a mutation with amino acid mass difference δ = 50 in c and a mutation with amino acid mass difference δ1 = 30 in d. Alignment with k = 2 detects a second mutation with amino acid mass difference δ2 = 50 in d.
Figure 3
Figure 3
Shift function F(x) for simulated spectra of pairs of peptides differing by zero, one, and two mutations. The similarity between mutated peptides is captured by multiple peaks in the shift function (indicated by bold bars).
Figure 4
Figure 4
The matching spectra of mutated peptides with peptides in a small database (100 peptides) at different values of spectral quality p and number of mutations k. The first two pair of plots describe matching with SIM1 and SIM2 similarity scores for k = 1 and k = 2 mutations. The third pair of plots describes matching with the Shared Peaks Count (SPC). Crosses represent best matches, dots represent second-best matches. A cross at position (i, i) on the main diagonal represents the correct matching of spectra i and peptide i.
Figure 5
Figure 5
Database search success rate of spectral convolution approach with SIMk scores for the simulated spectra. A match is successful if one of the indicated top-scored spectra matches a correct peptide. The number shown next to a curve is the number of mutated amino acids k.
Figure 6
Figure 6
Database search success rate of spectral alignment approach for the simulated spectra. A match is successful if one of indicated top-scored spectra matches a correct peptide. The number next to a curve is the number of mutated amino acids k.
Figure 7
Figure 7
Success rate of the spectral alignment approach as a function of number of top scores at qualities p = 0.3 and p = 0.5 of the simulated spectra. A match is considered correct if the correct peptide is among t top scoring peptides in the database. The database consists of 10,000 peptides.
Figure 8
Figure 8
The success rate of database search versus the number considered top- scoring while matching experimental sample against yeast tryptic peptides database with (a) mutation-tolerant branch-and-bound algorithm, (b) modification-tolerant branch-and-bound algorithm, and (c) spectral alignment algorithm.

Comment in

References

    1. Blom N, Gammeltoft S, Brunak S. Sequence- and structure-based prediction of eukaryotic protein phosphorylation sites. J Mol Biol. 1999;294:1351–1362. - PubMed
    1. Bushnell ML, Chen X. Efficient Branch and Bound Search With Application to Computer-Aided Design. Kluwer Academic Publishers; 1996.
    1. Clauser KR, Baker PR, Burlingame AL. The role of accurate mass measurement ( + /– 10ppm) in protein identification strategies employing MS or MS/MS and database searching. Anal Chem. 1999;71:2871–2882. - PubMed
    1. Dancik V, Addona T, Clauser K, Vath J, Pevzner PA. De novo peptide sequencing via tandem mass spectrometry. J Comp Biol. 1999;6:327–342. - PubMed
    1. Eng J, McCormack A, Yates J. An approach to correlate tandem mass spectral data of peptides with amino acid sequences in a protein database. J Amer Soc Mass Spect. 1994;5:976–989. - PubMed

Publication types

MeSH terms

LinkOut - more resources