. 2001 Feb;117(2):133-48.
doi: 10.1085/jgp.117.2.133.

Cooperative mechanisms in the activation dependence of the rate of force development in rabbit skinned skeletal muscle fibers

Affiliations

Cooperative mechanisms in the activation dependence of the rate of force development in rabbit skinned skeletal muscle fibers

D P Fitzsimons et al. J Gen Physiol. 2001 Feb.

Abstract

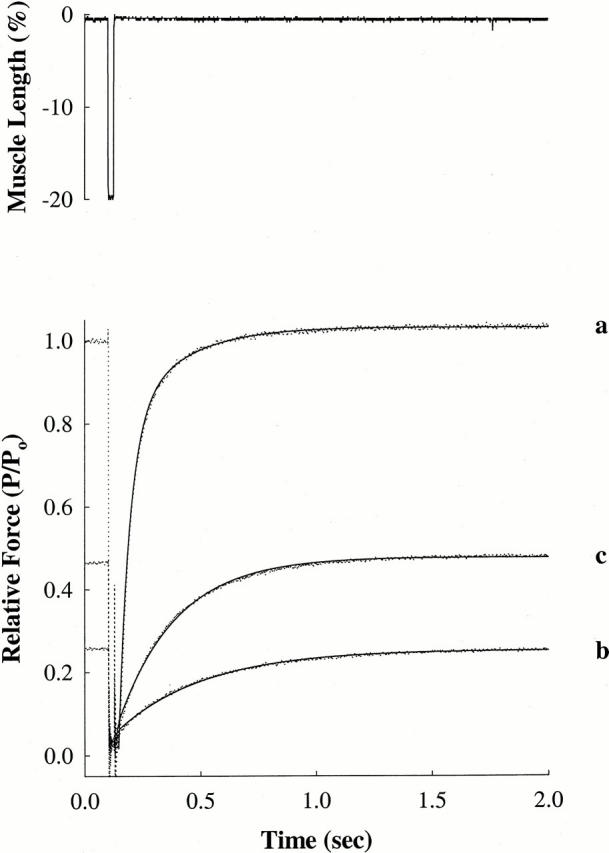
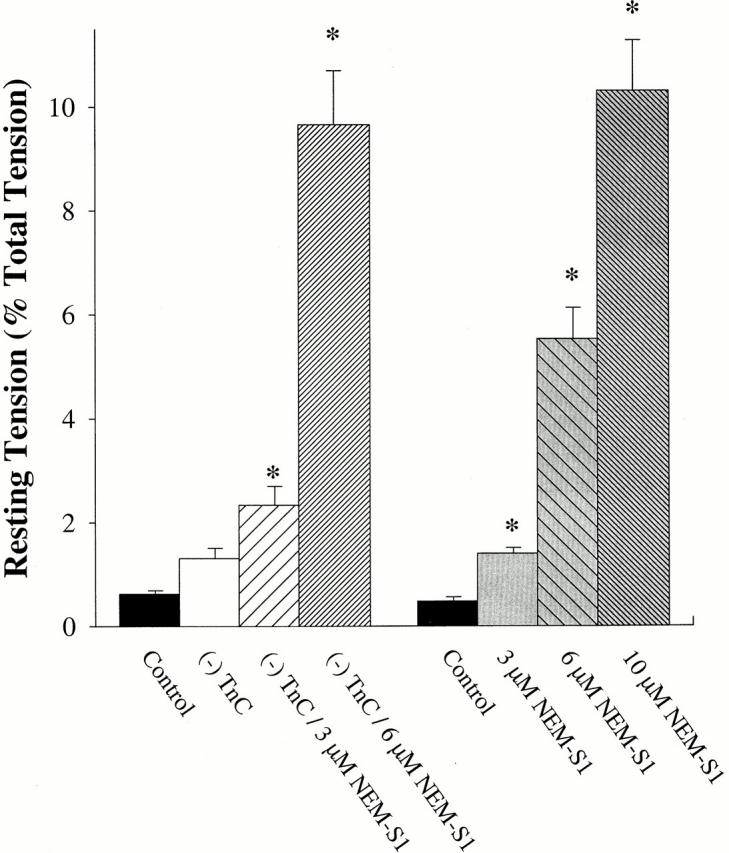
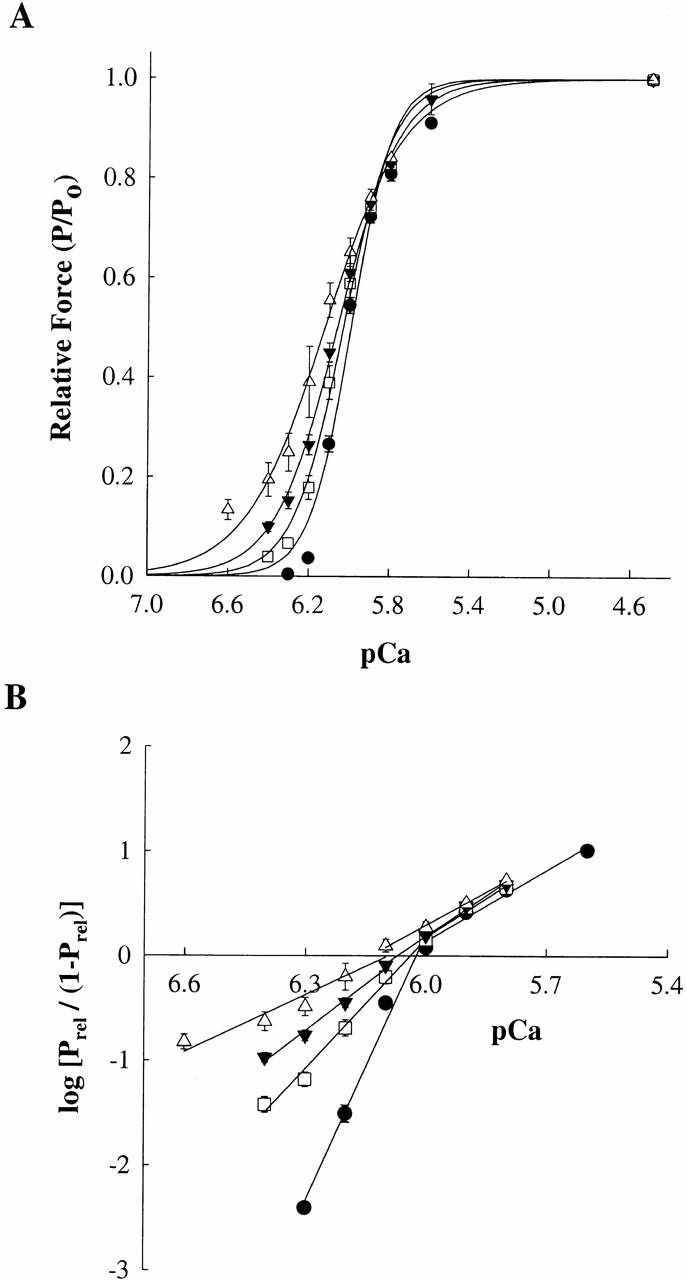
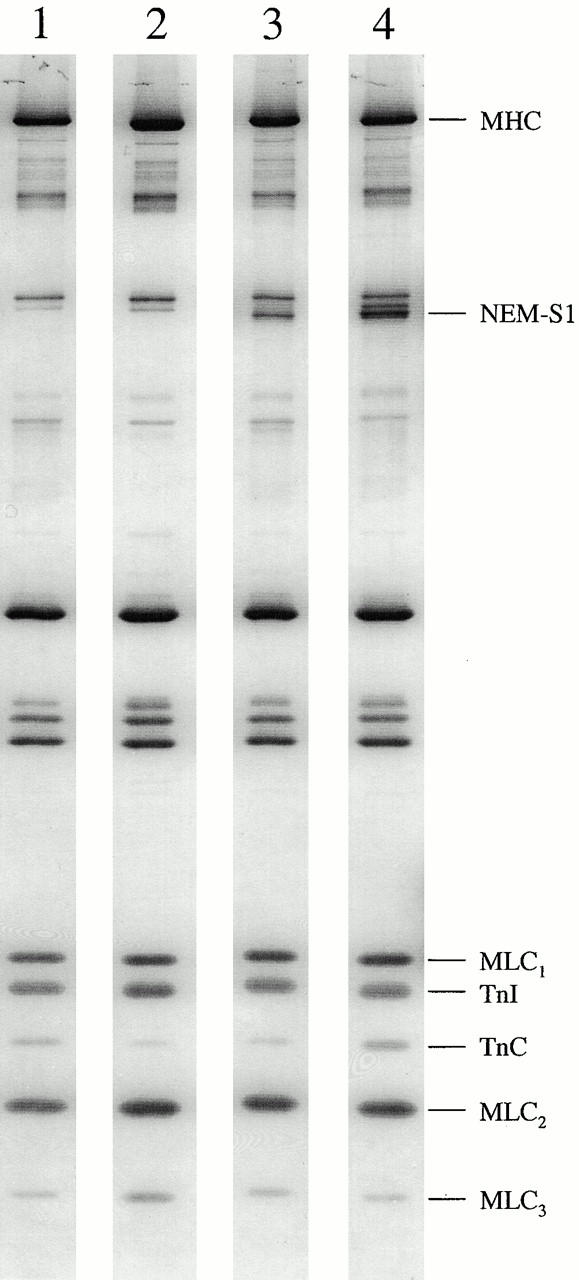
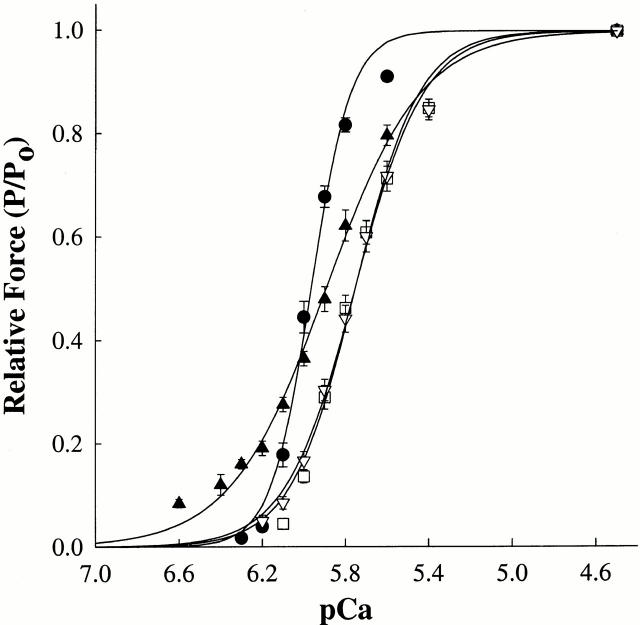
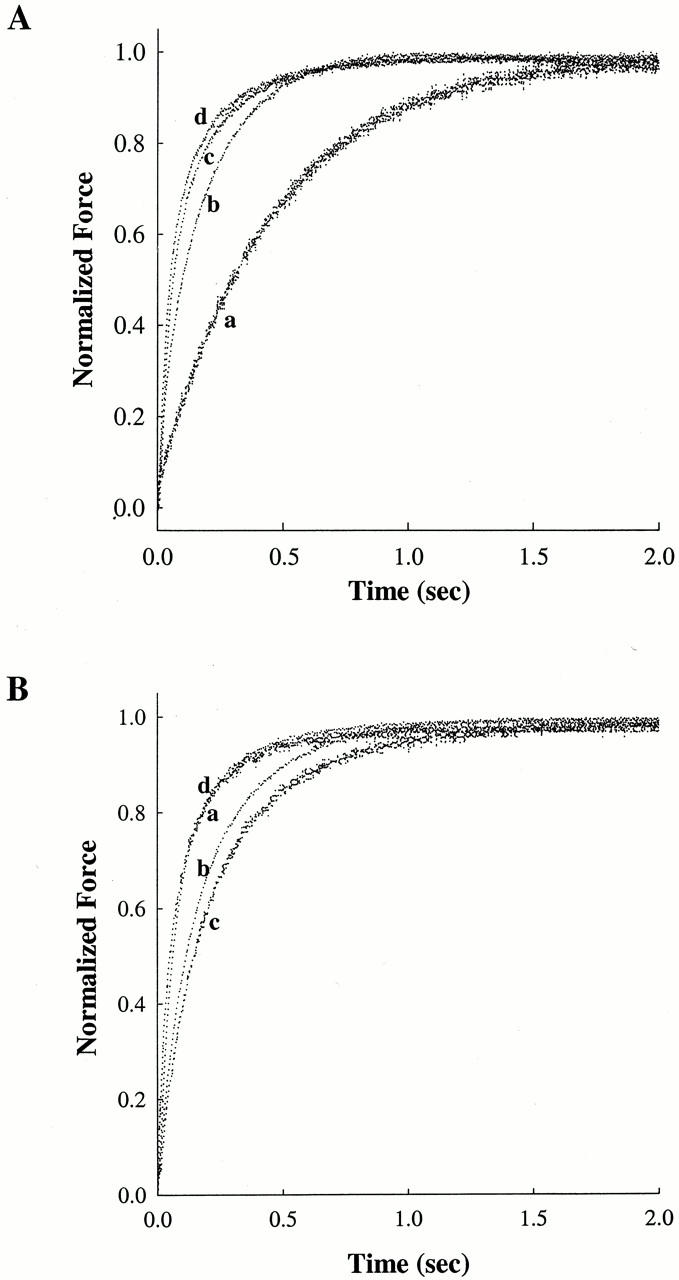
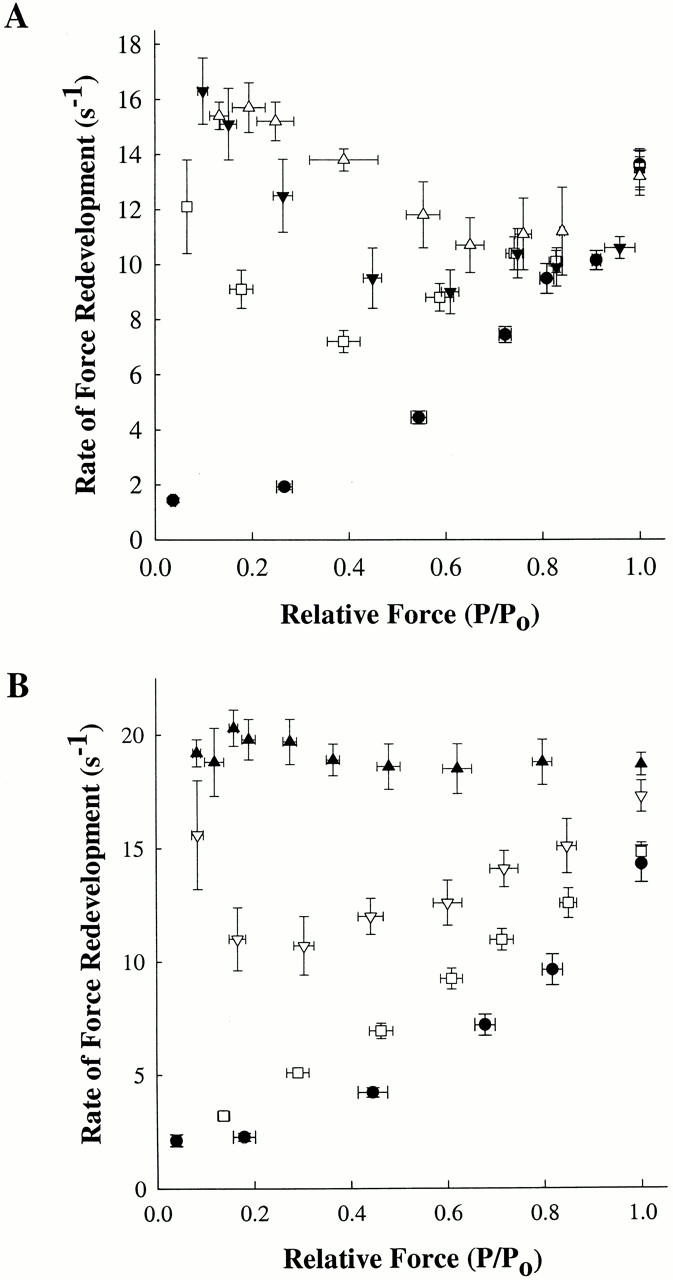
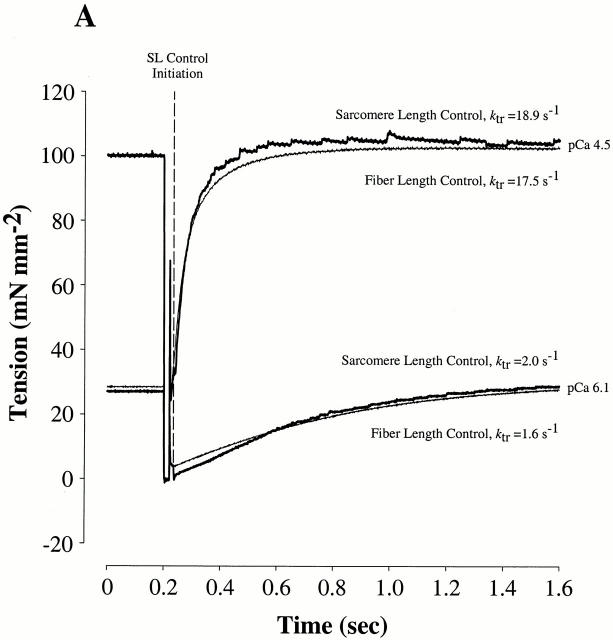
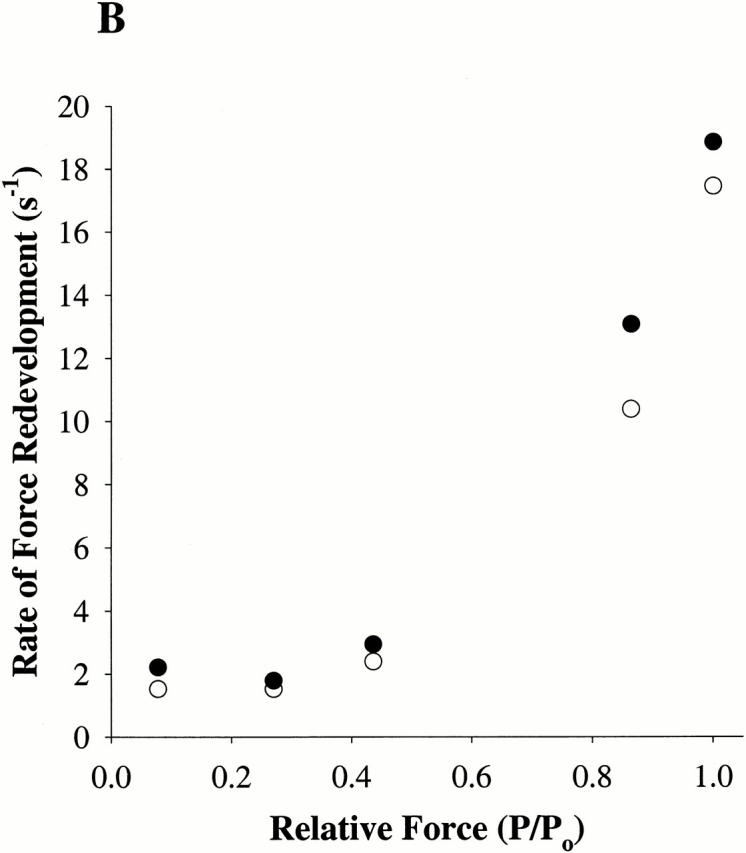
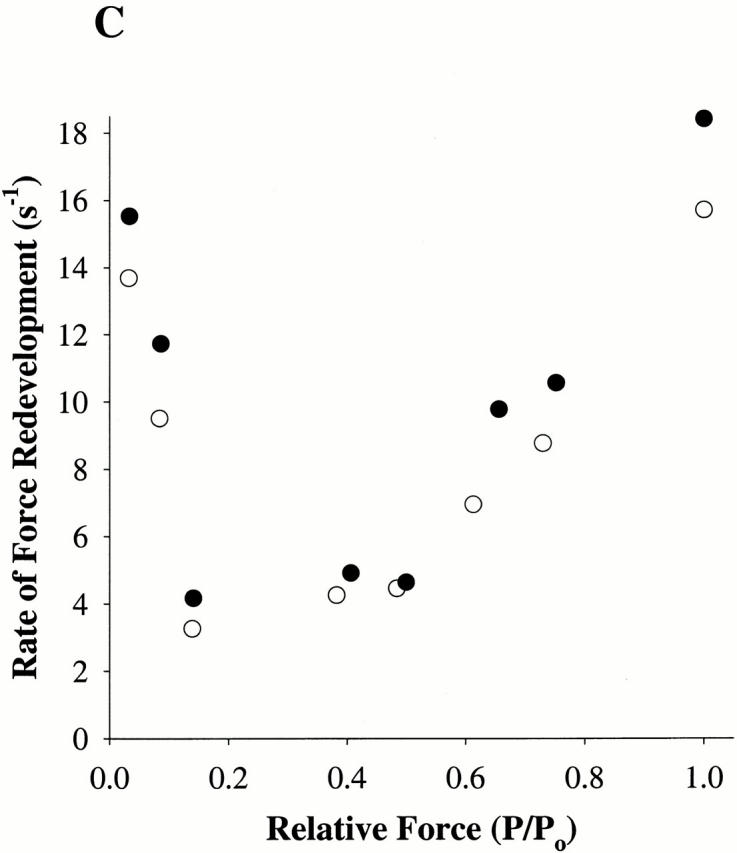
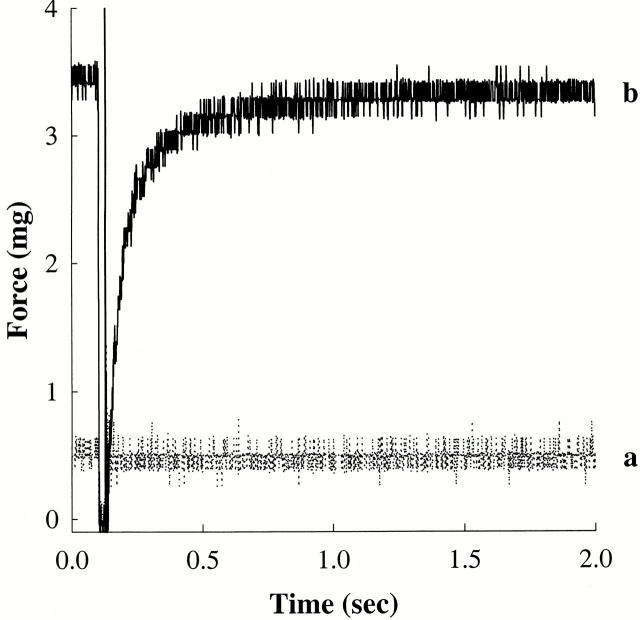
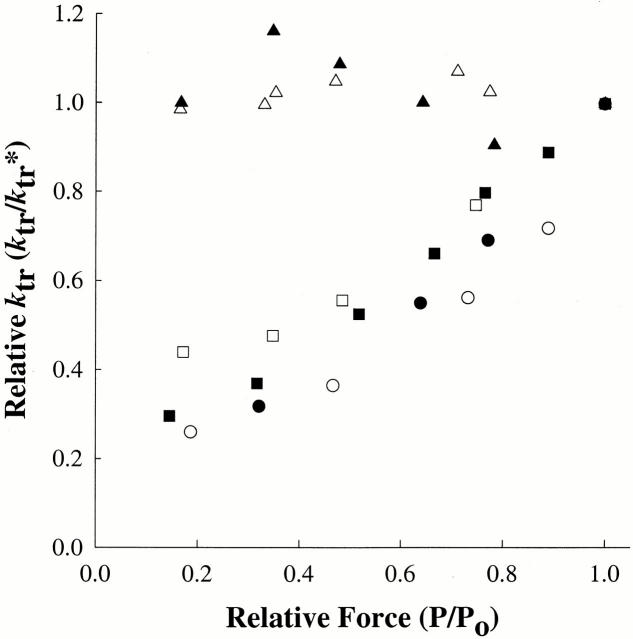
Regulation of contraction in skeletal muscle is a highly cooperative process involving Ca(2+) binding to troponin C (TnC) and strong binding of myosin cross-bridges to actin. To further investigate the role(s) of cooperation in activating the kinetics of cross-bridge cycling, we measured the Ca(2+) dependence of the rate constant of force redevelopment (k(tr)) in skinned single fibers in which cross-bridge and Ca(2+) binding were also perturbed. Ca(2+) sensitivity of tension, the steepness of the force-pCa relationship, and Ca(2+) dependence of k(tr) were measured in skinned fibers that were (1) treated with NEM-S1, a strong-binding, non-force-generating derivative of myosin subfragment 1, to promote cooperative strong binding of endogenous cross-bridges to actin; (2) subjected to partial extraction of TnC to disrupt the spread of activation along the thin filament; or (3) both, partial extraction of TnC and treatment with NEM-S1. The steepness of the force-pCa relationship was consistently reduced by treatment with NEM-S1, by partial extraction of TnC, or by a combination of TnC extraction and NEM-S1, indicating a decrease in the apparent cooperativity of activation. Partial extraction of TnC or NEM-S1 treatment accelerated the rate of force redevelopment at each submaximal force, but had no effect on kinetics of force development in maximally activated preparations. At low levels of Ca(2+), 3 microM NEM-S1 increased k(tr) to maximal values, and higher concentrations of NEM-S1 (6 or 10 microM) increased k(tr) to greater than maximal values. NEM-S1 also accelerated k(tr) at intermediate levels of activation, but to values that were submaximal. However, the combination of partial TnC extraction and 6 microM NEM-S1 increased k(tr) to virtually identical supramaximal values at all levels of activation, thus, completely eliminating the activation dependence of k(tr). These results show that k(tr) is not maximal in control fibers, even at saturating [Ca(2+)], and suggest that activation dependence of k(tr) is due to the combined activating effects of Ca(2+) binding to TnC and cross-bridge binding to actin.


Figures

Figure 1
Figure 1
Force redevelopment traces in a skinned psoas fiber at maximal and submaximal levels of Ca2+ activation. (Top) Depicts the mechanical release-restretch maneuver imposed on a skinned psoas fiber to determine the rate constant of force redevelopment (k tr). The length change was sufficient to slacken the fiber, so that shortening velocity was maximal. (Bottom) Changes in submaximal force in solutions of pCa 6.1 (trace b) and pCa 6.0 (trace c) in a skinned psoas fiber under control conditions. The change in force is expressed relative to the maximum force (Po) generated by the same fiber under control conditions when exposed to a solution of pCa 4.5 (trace a). The solid lines are exponential fits to the data: single exponentials were adequate for fits at low and intermediate [Ca2+], whereas two exponentials were required for fits at maximal [Ca2+]. These fits are for illustrative purposes only, as k tr was calculated in each case from the half-time of tension rise, as described in materials and methods. Table summarizes the double exponential fits at low, intermediate, and high levels of activation.
Figure 2
Figure 2
Effect of partial TnC extraction and NEM-S1 treatment on resting tension. Values are mean ± SEM, with numbers of fibers per treatment listed in Table . (−) TnC indicates partial TnC extraction. (Asterisk) Statistical difference experimental groups versus appropriate control groups, P < 0.05.
Figure 3
Figure 3
Effect of NEM-S1 on the force-pCa relationships in skinned psoas fibers. Values are means ± SEM. Fiber characteristics are listed in Table . (A) Force-pCa relationships were determined in control fibers and in the same fibers after exposure to NEM-S1. Smooth lines were generated by fitting the mean data with the Hill equation: P/Po = [Ca2+]n/(k n + [Ca2+]n), where n is the Hill coefficient, and k is the [Ca2+] required for half-maximal activation (i.e., pCa50). pCa50 values from skinned fibers in the absence and presence of NEM-S1 were as follows: control (•), 6.00 ± 0.01; 3 μM NEM-S1 (□), 6.04 ± 0.02; 6 μM NEM-S1 (▾), 6.06 ± 0.02; and 10 μM NEM-S1 (▵), 6.12 ± 0.04. (B) Hill plot transformations of the tension-pCa data were generated using the following equation: log[Prel/(1 − Prel)] = n(log[Ca2+] + k), where Prel is force as a fraction of Po, n is the Hill coefficient, and k is the [Ca2+] required for half-maximal activation (i.e., pCa50).
Figure 4
Figure 4
Troponin C content of single psoas fibers after partial extraction of TnC. 12% SDS-PAGE of single-skinned psoas fibers before TnC extraction (lane 1), after partial TnC extraction (lanes 2 and 3), and after readdition of skeletal TnC to a TnC-extracted fiber (lane 4). To quantify the amount of TnC extracted, the ratio [TnC/(LC1 + LC2)] was determined for control, extracted, and reconstituted fiber segments by measuring the areas under the densitometric peaks corresponding to these proteins. The ratios from extracted and reconstituted fiber segments were divided by the ratio from a control segment of the same fiber to determine TnC content. Approximately 50% of endogenous TnC was extracted (lane 2 and 3) from these fibers, whereas readdition of skeletal TnC was stoichiometric (lane 4). Comparisons of the [MLC2/(MLC1 + MLC3)] ratios revealed no alterations in MLC2 content after partial TnC extraction.
Figure 5
Figure 5
Effects of partial TnC extraction and NEM-S1 on force-pCa relationships in skinned psoas fibers. Values are means ± SEM. Force-pCa relationships were determined in control fibers and then in the same fibers after treatment with NEM-S1. Smooth lines were generated by fitting the mean data with the Hill equation: P/Po = [Ca2+]n/(k n + [Ca2+]n), where n is the Hill coefficient, and k is the [Ca2+] required for half-maximal activation (i.e., pCa50). pCa50 values from skinned fibers under control conditions, after partial TnC extraction ((−) TnC) and after partial TnC and NEM-S1 treatment were as follows: control (•), 5.97 ± 0.01; (−) TnC (□), 5.75 ± 0.02; (−) TnC/3 μM NEM-S1 (▿), 5.76 ± 0.02; and (−) TnC / 6 μM NEM-S1 (▴), 5.89 ± 0.02. Fiber characteristics are listed in Table .
Figure 6
Figure 6
Effects of reduced cooperativity of activation on the rate of force redevelopment. Differences in the rate constant of force redevelopment (k tr) were expressed relative to respective peak forces. (A) The rates of force redevelopment at pCa 6.1 in skinned psoas fibers in the absence (trace a, P/Po = 0.20, k tr = 2.2 s−1) and presence of 3 μM NEM-S1, (trace b, P/Po = 0.41, k tr = 7.1 s−1), 6 μM NEM-S1 (trace c, P/Po = 0.47, k tr = 12.6 s−1), or 10 μM NEM-S1 (trace d, P/Po = 0.53, k tr = 14.1 s−1). Maximal k tr was 15.1 s−1 for the fiber in traces a and c, 15.8 s−1 for the fiber in trace b, and 15.4 s−1 for the fiber in trace d. (B) The rates of force redevelopment in skinned psoas fibers incubated in solutions of pCa 4.5 (trace a, P/Po = 1.0, k tr = 11.4 s−1) and pCa 5.9 under control conditions (trace b, P/Po = 0.64, k tr = 5.9 s−1), after partial TnC extraction (trace c, P/Po = 0.32, k tr = 5.1 s−1), and after the combined treatment of partial TnC extraction and 6 μM NEM-S1 (trace d, P/Po = 0.48, k tr = 18.7 s−1). The relative force values obtained at pCa 5.9 were normalized to 1.0 to allow comparisons between the various experimental conditions, i.e., control, TnC-extracted or TnC-extracted/NEM-S1.
Figure 7
Figure 7
Alteration in the activation dependence of the rate of force redevelopment after partial extraction of TnC and treatment with NEM-S1. Force redevelopment following the release-restretch mechanical maneuver was recorded as a function of relative steady-state isometric force (P/Po) developed before the maneuver. All values are means ± SEM. (A) NEM-S1–induced effects on the force dependence of k tr in the absence (•) and presence of 3 μM NEM-S1 (□), 6 μM NEM-S1 (▾), and 10 μM NEM-S1 (▵). (B) Force dependence of k tr in fibers under control conditions (•), after partial TnC extraction (□), partial TnC extraction, and after treatment with 3 μM NEM-S1 (▿), and partial TnC extraction and treatment with 6 μM NEM-S1 (▴).
Figure 8
Figure 8
Effects of NEM-S1 on the rate of force redevelopment measured under sarcomere length control. (A) Force redevelopment records from a single psoas fiber during maximal (pCa 4.5) and submaximal (pCa 6.1) levels of Ca2+ activation and under either sarcomere length or fiber length control. Sarcomere length control was done as described previously by Campbell and Moss 2000. (B) Plot showing the activation dependence of k tr measured in an untreated control fiber without (○) and with (•) sarcomere length control. (C) Plot showing the activation dependence of k tr measured in a fiber after treatment with 3 μM NEM-S1, both without (○) and with (•) sarcomere length control.
Figure 8
Figure 8
Effects of NEM-S1 on the rate of force redevelopment measured under sarcomere length control. (A) Force redevelopment records from a single psoas fiber during maximal (pCa 4.5) and submaximal (pCa 6.1) levels of Ca2+ activation and under either sarcomere length or fiber length control. Sarcomere length control was done as described previously by Campbell and Moss 2000. (B) Plot showing the activation dependence of k tr measured in an untreated control fiber without (○) and with (•) sarcomere length control. (C) Plot showing the activation dependence of k tr measured in a fiber after treatment with 3 μM NEM-S1, both without (○) and with (•) sarcomere length control.
Figure 9
Figure 9
Force redevelopment time course at pCa 9.0 in NEM-S1–treated fiber. Ca2+-independent force and force redevelopment in a representative skinned psoas fiber in skinned single fibers in the absence (trace a) and presence of 10 μM NEM-S1 (trace b). Force at pCa 4.5 (Po) in the absence of NEM-S1 was 139 mN/mm2; k tr under the same conditions was 12.8 s−1. Ca2+-independent force in the absence of NEM-S1 was 0.8% Po; Ca2+-independent force in the presence of NEM-S1 was 8.5% Po; k tr in the presence of NEM-S1 was 19.3 s−1.
Figure 10
Figure 10
Effects of variable extraction of TnC on the activation dependence of k tr. The relationship between k tr and the relative force is presented for two distinct fibers, 2801B (open symbols) and 2901B (closed symbols), under control conditions (○, •) after partial TnC extraction (□, ▪), and after partial TnC extraction and treatment with 6 μM NEM-S1 (▵, ▴). Varying the extent of TnC extraction (by reducing the incubation time in extracting solution) reduced the maximal force to 0.15 Po in fiber 2801B and to 0.65 Po in fiber 2901B.

Similar articles

Cited by

References

    1. Brandt P., Schachat F. Troponin C modulates the activation of the thin filaments by rigor cross-bridges. Biophys. J. 1997;72:2262–2267. - PMC - PubMed
    1. Brandt P.W., Diamond M.S., Schachat F.H. The thin filament of vertebrate skeletal muscle co-operatively activates as a unit. J. Mol. Biol. 1984;180:379–384. - PubMed
    1. Brandt P.W., Roemer D., Schachat F.H. Cooperative activation of skeletal muscle thin filaments by rigor crossbridgesthe effect of troponin C extraction. J. Mol. Biol. 1990;212:473–480. - PubMed
    1. Brenner B. Effect of Ca2+ on cross-bridge turnover kinetics in skinned single rabbit psoas fibersimplications for regulation of muscle contraction. Proc. Natl. Acad. Sci. USA. 1988;85:3265–3269. - PMC - PubMed
    1. Brenner B., Eisenberg E. Rate of force generation in musclecorrelation with actomyosin ATPase activity in solution. Proc. Natl. Acad. Sci. USA. 1986;83:3542–3546. - PMC - PubMed

Publication types

MeSH terms