

Regional alterations of repolarizing K+ currents among the left ventricular free wall of rats with ascending aortic stenosis
- PMID: 11158275
- PMCID: PMC2278429
- DOI: 10.1111/j.1469-7793.2001.0443k.x
Regional alterations of repolarizing K+ currents among the left ventricular free wall of rats with ascending aortic stenosis
Abstract
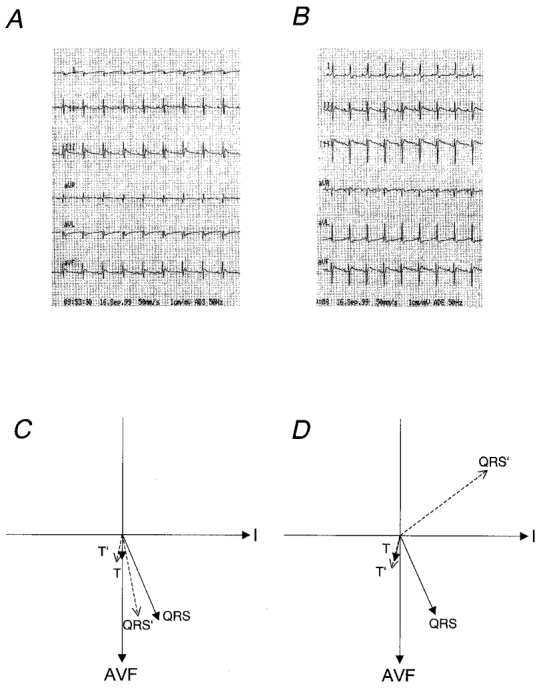
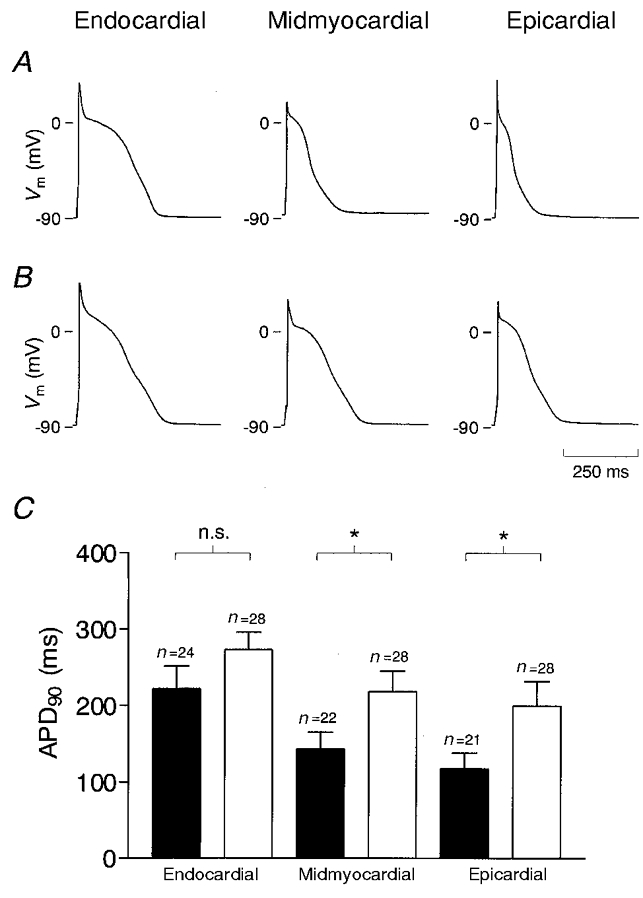
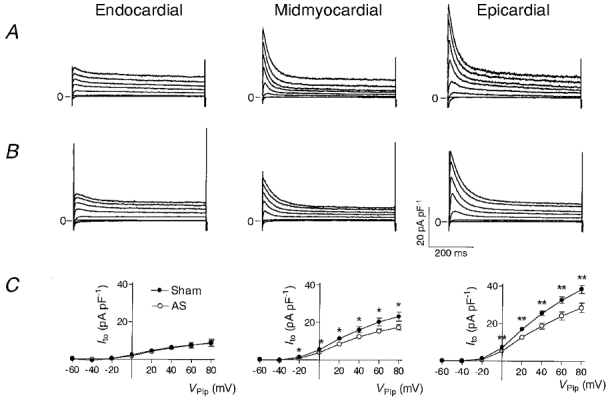
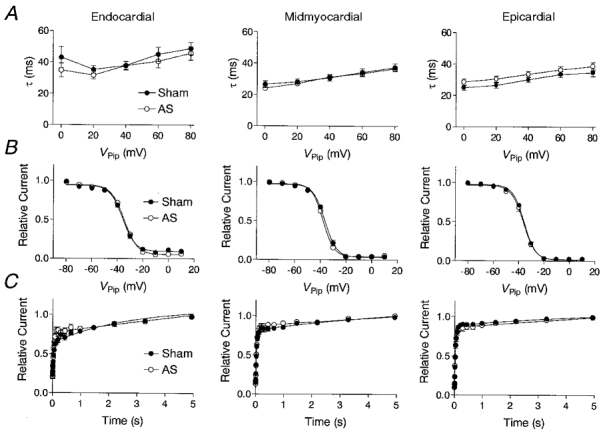
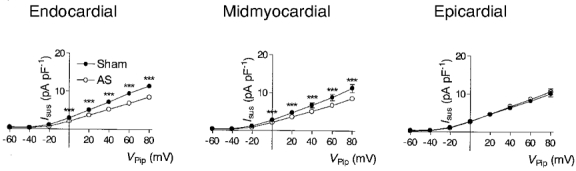
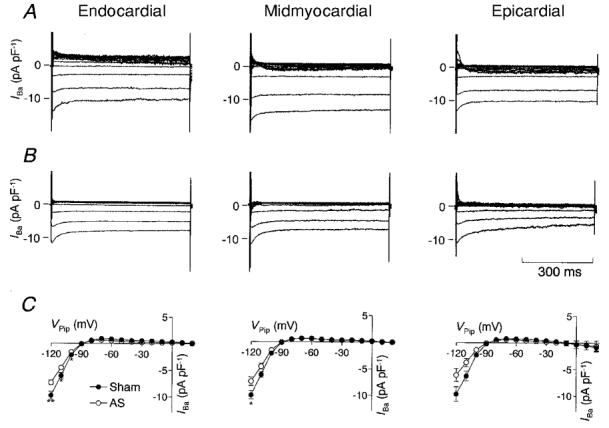
The effect of cardiac hypertrophy on electrocardiogram (ECG), action potential duration (APD) and repolarizing K+ currents was investigated in epicardial, midmyocardial and endocardial myocytes isolated from the rat left ventricular free wall. Cardiac hypertrophy was induced by stenosis of the ascending aorta (AS), which led to an increased pressure load (+85 +/- 10 u1v1vZ mm11Z Hg) of the left ventricle; sham-operated animals served as controls. In ECG recordings from AS rats, the QTc interval was prolonged and the main vectors of the QRS complex and the T-wave pointed in opposite directions, indicating an abnormal sequence of repolarization. APD and K+ currents were recorded using the whole-cell patch-clamp technique. In the AS group, APD90 (90 % repolarization) was significantly prolonged in epicardial and midmyocardial, but not endocardial myocytes. Corresponding to the increase in APD, the magnitude of the transient outward K+ current (Ito1) was significantly smaller (-30 %) in epicardial and midmyocardial, but not endocardial myocytes. Inactivation and steady-state inactivation of Ito1 were not affected by hypertrophy. Recovery from inactivation was slightly prolonged in endocardial myocytes from AS rats. No differences in delayed rectifier currents (IK) or inwardly rectifying K+ currents (IK1) were detected between myocytes of the three regions of sham-operated or AS animals. However, both currents were reduced by AS. The present data show that cardiac hypertrophy caused by pressure overload leads to an increase in APD and a decrease in Ito1 primarily in epicardial and midmyocardial myocytes, which implies a major role of alterations in Ito1 for the reduced gradient in APD. The effects of AS on IK1 and IK may slightly counteract the decrease in APD gradient. The observed changes in APD and underlying ionic currents could well explain the alterations in repolarization observed in the ECG induced by cardiac hypertrophy.
Figures
Similar articles
-
Ionic bases for electrophysiological distinctions among epicardial, midmyocardial, and endocardial myocytes from the free wall of the canine left ventricle.Circ Res. 1993 Mar;72(3):671-87. doi: 10.1161/01.res.72.3.671. Circ Res. 1993. PMID: 8431990
-
Repolarizing K+ currents in nonfailing human hearts. Similarities between right septal subendocardial and left subepicardial ventricular myocytes.Circulation. 1995 Sep 1;92(5):1179-87. doi: 10.1161/01.cir.92.5.1179. Circulation. 1995. PMID: 7648663
-
Transmural heterogeneity of action potentials and Ito1 in myocytes isolated from the human right ventricle.Am J Physiol. 1998 Aug;275(2):H369-77. doi: 10.1152/ajpheart.1998.275.2.H369. Am J Physiol. 1998. PMID: 9683422
-
[Transient outward potassium current and repolarization of cardiac cells].Bull Acad Natl Med. 1998;182(2):325-33; discussion 333-5. Bull Acad Natl Med. 1998. PMID: 9648347 Review. French.
-
Electrical heterogeneity within the ventricular wall.Basic Res Cardiol. 2001 Nov;96(6):517-27. doi: 10.1007/s003950170002. Basic Res Cardiol. 2001. PMID: 11770069 Review.
Cited by
-
Transient outward potassium channel: a heart failure mediator.Heart Fail Rev. 2015 May;20(3):349-62. doi: 10.1007/s10741-015-9474-y. Heart Fail Rev. 2015. PMID: 25646587 Review.
-
Effect of fosinopril on the transient outward potassium current of hypertrophied left ventricular myocardium in the spontaneously hypertensive rat.Naunyn Schmiedebergs Arch Pharmacol. 2014 May;387(5):419-25. doi: 10.1007/s00210-014-0956-6. Epub 2014 Jan 19. Naunyn Schmiedebergs Arch Pharmacol. 2014. PMID: 24441766
-
Basal and IGF-I-dependent regulation of potassium channels by MAP kinases and PI3-kinase during eccentric cardiac hypertrophy.Am J Physiol Heart Circ Physiol. 2008 Nov;295(5):H1834-45. doi: 10.1152/ajpheart.321.2008. Epub 2008 Aug 29. Am J Physiol Heart Circ Physiol. 2008. PMID: 18757484 Free PMC article.
-
Electrophysiological characteristics of pressure overload-induced cardiac hypertrophy and its influence on ventricular arrhythmias.PLoS One. 2017 Sep 1;12(9):e0183671. doi: 10.1371/journal.pone.0183671. eCollection 2017. PLoS One. 2017. PMID: 28863155 Free PMC article.
-
Molecular determinants of cardiac transient outward potassium current (I(to)) expression and regulation.J Mol Cell Cardiol. 2010 Jan;48(1):12-25. doi: 10.1016/j.yjmcc.2009.07.013. Epub 2009 Jul 18. J Mol Cell Cardiol. 2010. PMID: 19619557 Free PMC article. Review.
References
-
- Agus ZS, Dukes ID, Morad M. Divalent cations modulate the transient outward current in rat ventricular myocytes. American Journal of Physiology. 1991;261:C310–318. - PubMed
-
- Antzelevitch C, Shimizu W, Yan GX, Sicouri S, Weissenburger J, Nesterenko VV, Burashnikov A, Di Diego J, Saffitz J, Thomas GP. The M cell: its contribution to the ECG and to normal and abnormal electrical function of the heart. Journal of Cardiovascular Electrophysiology. 1999;10:1124–1152. - PubMed
-
- Bazett HC. An analysis of the time relationships of the electrocardiogram. Heart. 1920;7:353.
-
- Brahmajothi MV, Campbell DL, Rasmusson RL, Morales MJ, Trimmer JS, Nerbonne JM, Strauss HC. Distinct transient outward potassium current (Ito) phenotypes and distribution of fast-inactivating potassium channel α subunits in ferret left ventricular myocytes. Journal of General Physiology. 1999;113:581–600. - PMC - PubMed
Publication types
MeSH terms
Substances
LinkOut - more resources
Full Text Sources
Research Materials