. 2001 Jan;13(1):101-11.
doi: 10.1105/tpc.13.1.101.

CYP83B1, a cytochrome P450 at the metabolic branch point in auxin and indole glucosinolate biosynthesis in Arabidopsis

Affiliations

CYP83B1, a cytochrome P450 at the metabolic branch point in auxin and indole glucosinolate biosynthesis in Arabidopsis

S Bak et al. Plant Cell. 2001 Jan.

Abstract

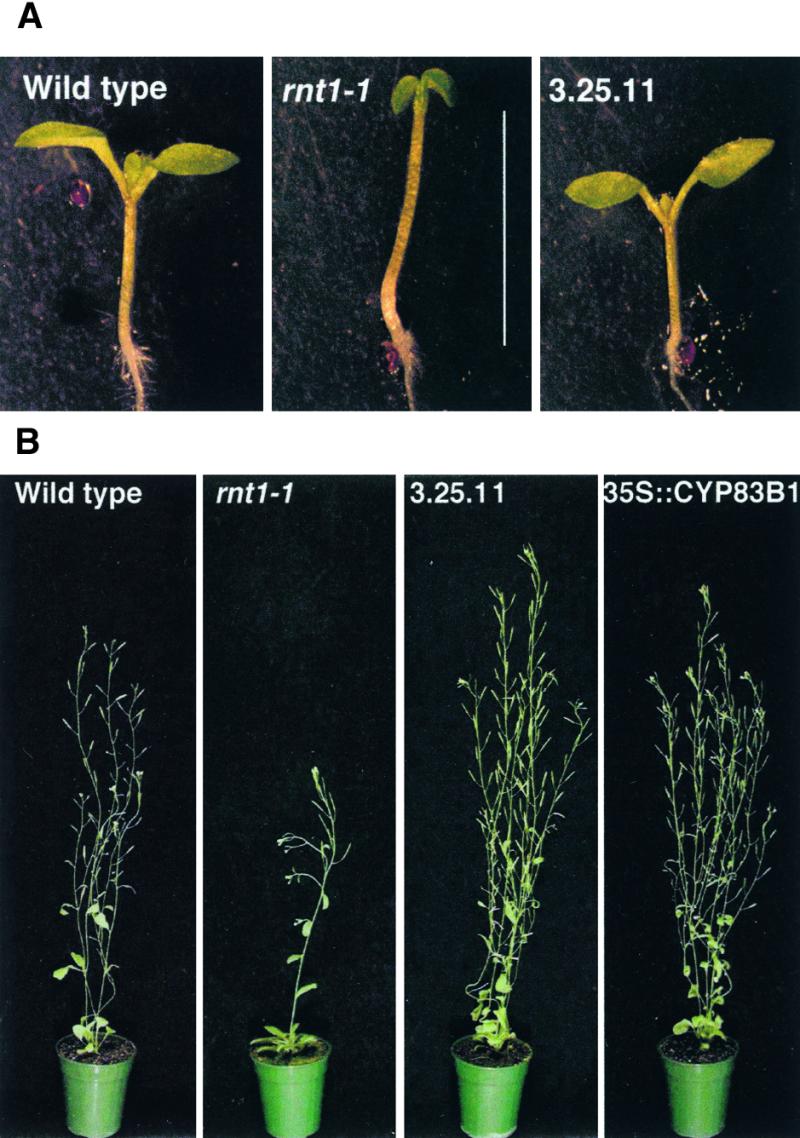
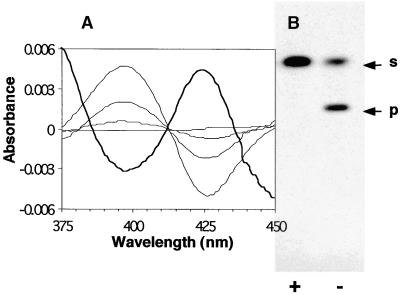
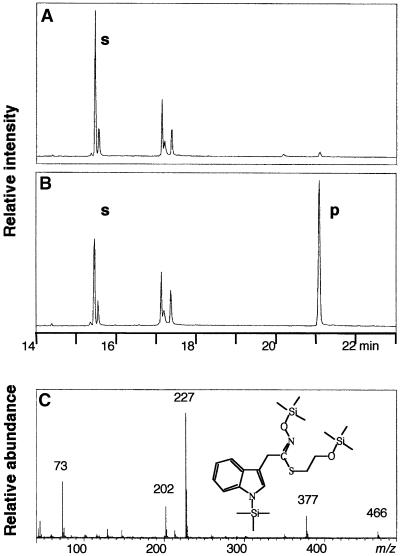
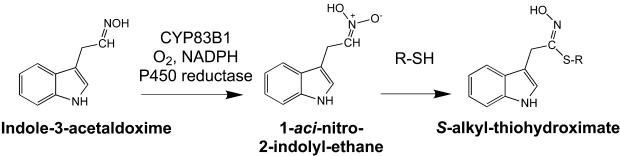
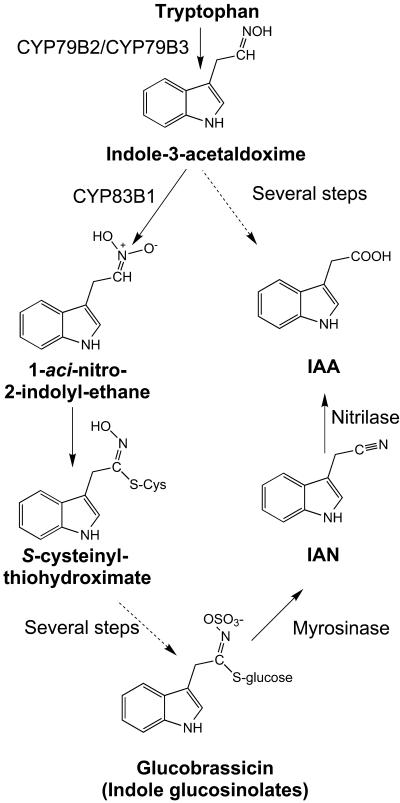
Auxins are growth regulators involved in virtually all aspects of plant development. However, little is known about how plants synthesize these essential compounds. We propose that the level of indole-3-acetic acid is regulated by the flux of indole-3-acetaldoxime through a cytochrome P450, CYP83B1, to the glucosinolate pathway. A T-DNA insertion in the CYP83B1 gene leads to plants with a phenotype that suggests severe auxin overproduction, whereas CYP83B1 overexpression leads to loss of apical dominance typical of auxin deficit. CYP83B1 N-hydroxylates indole-3-acetaldoxime to the corresponding aci-nitro compound, 1-aci-nitro-2-indolyl-ethane, with a K(m) of 3 microM and a turnover number of 53 min(-1). The aci-nitro compound formed reacts non-enzymatically with thiol compounds to produce an N-alkyl-thiohydroximate adduct, the committed precursor of glucosinolates. Thus, indole-3-acetaldoxime is the metabolic branch point between the primary auxin indole-3-acetic acid and indole glucosinolate biosynthesis in Arabidopsis.


Figures

Figure 1.
Figure 1.
Phenotypes of rnt1-1 Seedlings. Arrows indicate the approximate position of the root–hypocotyl junction. (A) Wild type at 2 weeks. (B) Adventitious roots are formed from the hypocotyl of rnt1-1 at 2 weeks. The scale is the same as in (A). (C) Peeling of tissue from the root–hypocotyl junction in rnt1-1 seedling at 1 week. (D) Disintegration of the hypocotyl, adventitious root formation and callus formation, and development of callus from secondary roots in rnt1-1 plant at 6 weeks.
Figure 2.
Figure 2.
Molecular Complementation of rnt1-1. (A) Seven-day-old seedlings of the wild type (3.65 ± 0.14 mm), rnt1-1 (5.06 ± 0.10 mm), and the molecularly complemented line 3.25.11 (3.00 ± 0.14 mm). The hypocotyl lengths of rnt1-1 and 3.25.11 differ significantly from that of the wild type at a 1% confidence level (t test). Bar = 5 mm. (B) Phenotypes of 6-week-old wild type, rnt1-1, molecularly complemented line 3.25.11, and overexpression line 1.4.7 (35S::CYP83B1).
Figure 3.
Figure 3.
Characterization of CYP83B1. (A) Analysis of CYP83B1 by optical difference spectroscopy. A saturated type IIa spectrum was obtained with 100 μM tryptamine (indicated by the thick line, with the trough at 390 nm and the peak at 425 nm) in the sample cuvette. The addition of 100 μM tryptamine to both cuvettes gave a baseline. The increasing concentrations of indole-3-acetaldoxime in the sample cuvette (0.2, 0.8, and 3.0 μM) then displaced tryptamine, giving the reverse type IIa spectrum. (B) Tryptamine is an inhibitor of CYP83B1 catalysis. We incubated 22 nM CYP83B1 with 35 μM 5-3H-indole-3-acetaldoxime in the absence (−) or presence (+) of 17.5 mM tryptamine. After incubation for 10 min at 28°C, reaction mixtures were extracted with ethyl acetate and analyzed by TLC. p, product; s, substrate.
Figure 4.
Figure 4.
Analysis of Reaction Mixtures using Gas Chromatography–Electron Impact Mode. After incubation for 0 min (A) or 15 min (B) at 28°C, reaction mixtures were subjected to gas chromatography–electron impact mode analysis (C). The new peak (p) at 21.083 min shows a molecular ion at m/z 466 and a fragmentation pattern consistent with the structure shown in the insert, with m/z 377, loss of the oxime O-trimethylsilyl (TMS); m/z 228, further loss of S-C2H5-O-TMS; m/z 202, further loss of nitrile; and m/z 73, TMS. The structure was verified by electrospray (ES)-MS of underivatized ethyl acetate–extracted reaction mixtures. p, TMS derivative of the β-mercaptoethanol adduct of the reaction mixture; s, TMS derivative of indole-3-acetaldoxime (15.467 min).
Figure 5.
Figure 5.
Proposed Reaction Scheme of CYP83B1. CYP83B1 catalyzes the first committed step of indole glucosinolate biosynthesis, the N-hydroxylation of indole-3-acetaldoxime to a highly reactive electrophile aci-nitro compound, 1-aci-nitro-2-indolyl-ethane, that non-enzymatically forms an adduct with a nucleophile (R-SH).
Figure 6.
Figure 6.
Indole Glucosinolate Levels Are Affected by CYP83B1 Expression. Indole glucosinolates in individual 2-week-old seedlings grown on Murashige and Skoog agar were quantified colorimetrically as thiocyanite (SCN), as described by Bak et al. (1999). Lane 1, wild type; lane 2, rnt1-1; lane 3, molecularly complemented line 3.25.11; lane 4, overexpression line 1.4.7; and lane 5, wild type grown on 100 μM tryptamine. Data are represented as the mean ±se; n = 10 seedlings. Except for the molecularly complemented line 3.25.11, mean indole glucosinolate values all differ from wild-type seedling values at a 1% confidence value (t test).
Figure 7.
Figure 7.
rnt1-1 Is Not Suppressed in a nit1-1 Background. (A) rnt1-1 at 2 weeks. (B) rnt1-1 in the nit1-1 background at 2 weeks. Arrows indicate the approximate position of the root–hypocotyl junction.
Figure 8.
Figure 8.
Indole-3-Acetaldoxime Is the Metabolic Branch Point between Indole Glucosinolates and IAA Biosynthesis. In rnt1-1, the pathway into indole glucosinolates through CYP83B1 is blocked, which leads to accumulation of IAA and plants with high IAA phenotype. Conversely, in CYP83B1 overexpression lines, additional indole-3-acetaldoxime is channeled into indole glucosinolate biosynthesis, which leads to plants with a low IAA phenotype and increased indole glucosinolate levels.

Comment in

Similar articles

Cited by

References

    1. Andersen, M.D., Busk, P.K., Svendsen, I., and Møller, B.L. (2000). Cytochromes P450 from cassava (Manihot esculenta Crantz) catalyzing the first steps in the biosynthesis of the cyanogenic glucosides linamarin and lotaustralin. Cloning, functional expression in Pichia pastoris, and substrate specificity of the isolated recombinant enzymes. J. Biol. Chem. 275 1966–1977. - PubMed
    1. Bak, S., Kahn, R.A., Nielsen, H.L., Møller, B.L., and Halkier, B.A. (1998. a). Cloning of three A-type cytochromes P450, CYP71E1, CYP98, and CYP99 from Sorghum bicolor (L.) Moench by a PCR approach and identification by expression in Escherichia coli of CYP71E1 as a multifunctional cytochrome P450 in the biosynthesis of the cyanogenic glucoside dhurrin. Plant Mol. Biol. 36 393–405. - PubMed
    1. Bak, S., Nielsen, H.L., and Halkier, B.A. (1998. b). The presence of CYP79 homologues in glucosinolate-producing plants shows evolutionary conservation of the enzymes in the conversion of amino acids til aldoxime in the biosynthesis of cyanogenic glucosides and glucosinolates. Plant Mol. Biol. 38 725–734. - PubMed
    1. Bak, S., Olsen, C.E., Petersen, B.L., Møller, B.L., and Halkier, B.A. (1999). Metabolic engineering of p-hydroxybenzylglucosinolate in Arabidopsis by expression of the cyanogenic CYP79A1 from Sorghum bicolor. Plant J. 20 663–671. - PubMed
    1. Barlier, I., Kowalczyk, M., Marchant, A., Ljung, K., Bhalerao, R., Bennett, M., Sandberg, G., and Bellini, C. (2000). The SUR2 gene of Arabidopsis thaliana encodes the cytochrome P450 CYP83B1, a modulator of auxin homeostasis. Proc. Natl. Acad. Sci. USA 97 14819–14824. - PMC - PubMed

Publication types

MeSH terms