

A highly variable segment of human subterminal 16p reveals a history of population growth for modern humans outstide Africa
- PMID: 11158547
- PMCID: PMC14675
- DOI: 10.1073/pnas.98.3.864
A highly variable segment of human subterminal 16p reveals a history of population growth for modern humans outstide Africa
Abstract
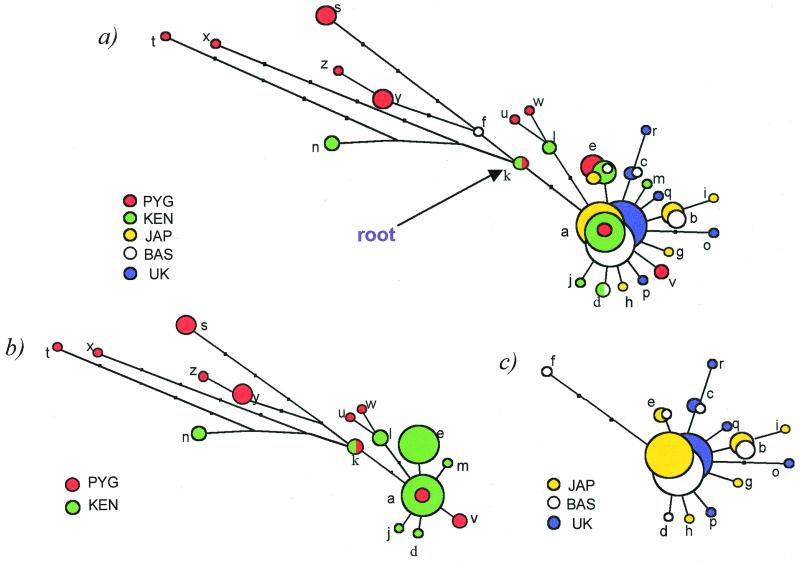
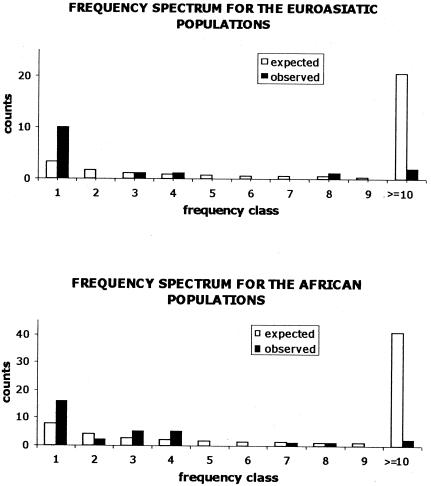
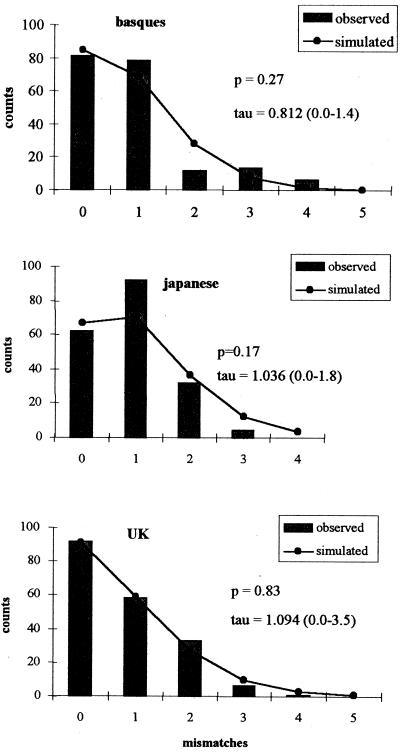
We have sequenced a highly polymorphic subterminal noncoding region from human chromosome 16p13.3 flanking the 5' end of the hypervariable minisatellite MS205, in 100 chromosomes sampled from different African and Euroasiatic populations. Coalescence analysis indicates that the time to the most recent common ancestor (approximately 1 million years) predates the appearance of anatomically modern human forms. The root of the network describing this variability lies in Africa. African populations show a greater level of diversity and deeper branches. Most Euroasiatic variability seems to have been generated after a recent out-of-Africa range expansion. A history of population growth is the most likely scenario for the Euroasiatic populations. This pattern of nuclear variability can be reconciled with inferences based on mitochondrial DNA.
Figures
Comment in
-
Order emerging from chaos in human evolutionary genetics.Proc Natl Acad Sci U S A. 2001 Jan 30;98(3):779-80. doi: 10.1073/pnas.98.3.779. Proc Natl Acad Sci U S A. 2001. PMID: 11158541 Free PMC article. Review. No abstract available.
References
-
- Hudson R R. In: Oxford Surveys in Evolutionary Biology. Futuyama D, Antonovics J, editors. New York: Oxford Univ. Press; 1990. pp. 1–44.
-
- Kaessman H, Heissig F, von Haeseler A, Pääbo S. Nat Genet. 1999;22:78–81. - PubMed
Publication types
MeSH terms
Associated data
- Actions
- Actions
- Actions
- Actions
- Actions
- Actions
- Actions
- Actions
- Actions
- Actions
- Actions
- Actions
- Actions
- Actions
- Actions
- Actions
- Actions
- Actions
- Actions
- Actions
- Actions
- Actions
- Actions
- Actions
- Actions
- Actions
- Actions
- Actions
- Actions
- Actions
- Actions
- Actions
- Actions
- Actions
- Actions
- Actions
- Actions
- Actions
- Actions
- Actions
- Actions
- Actions
- Actions
- Actions
- Actions
- Actions
- Actions
- Actions
- Actions
- Actions
- Actions
- Actions
- Actions
- Actions
- Actions
- Actions
- Actions
- Actions
- Actions
- Actions
- Actions
- Actions
- Actions
- Actions
- Actions
- Actions
- Actions
- Actions
- Actions
- Actions
- Actions
- Actions
- Actions
- Actions
- Actions
- Actions
- Actions
- Actions
- Actions
- Actions
- Actions
- Actions
- Actions
- Actions
- Actions
- Actions
- Actions
- Actions
- Actions
- Actions
- Actions
- Actions
- Actions
- Actions
- Actions
- Actions
- Actions
- Actions
- Actions
Grants and funding
LinkOut - more resources
Full Text Sources
Other Literature Sources
