

Analysis of gene expression profiles in normal and neoplastic ovarian tissue samples identifies candidate molecular markers of epithelial ovarian cancer
- PMID: 11158614
- PMCID: PMC14728
- DOI: 10.1073/pnas.98.3.1176
Analysis of gene expression profiles in normal and neoplastic ovarian tissue samples identifies candidate molecular markers of epithelial ovarian cancer
Abstract
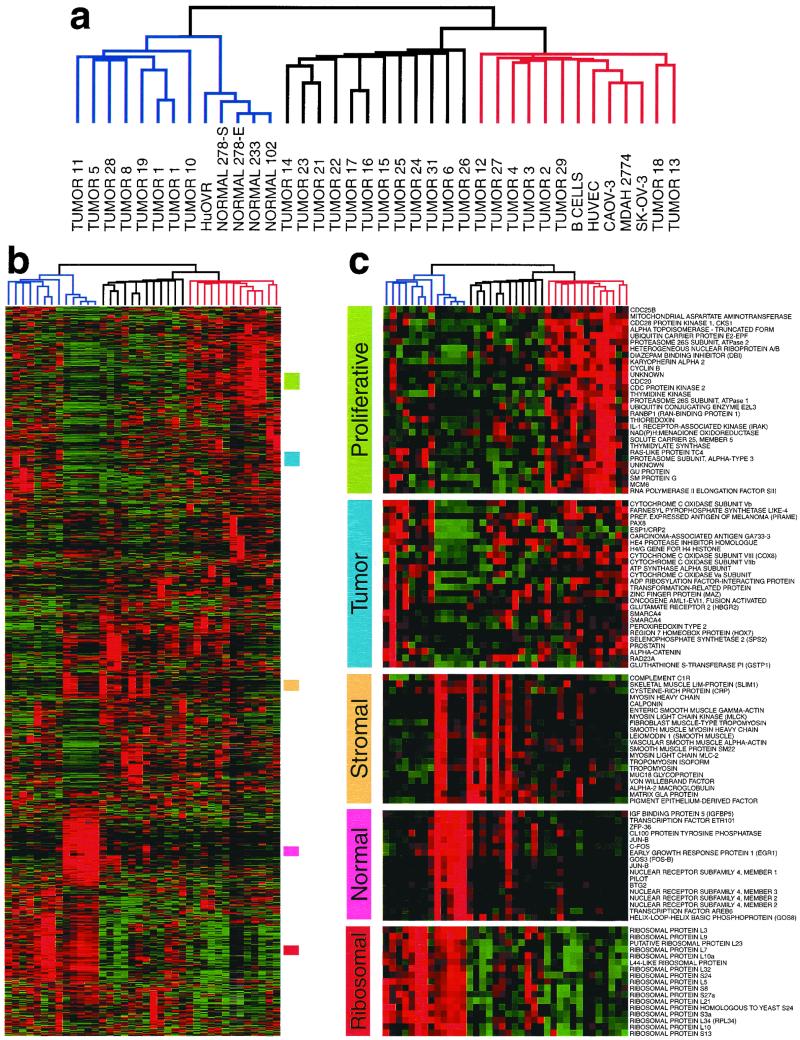
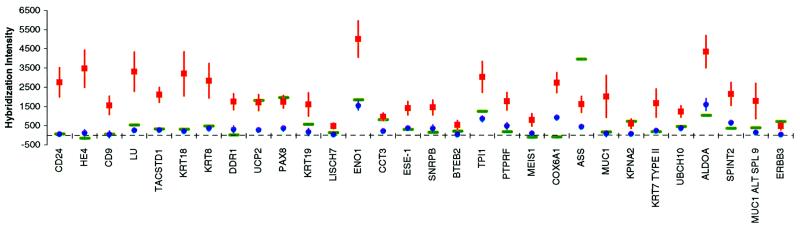
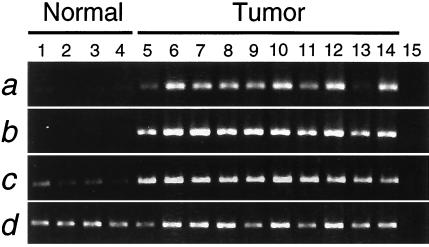
Epithelial ovarian cancer is the leading cause of death from gynecologic cancer, in part because of the lack of effective early detection methods. Although alterations of several genes, such as c-erb-B2, c-myc, and p53, have been identified in a significant fraction of ovarian cancers, none of these mutations are diagnostic of malignancy or predictive of tumor behavior over time. Here, we used oligonucleotide microarrays with probe sets complementary to >6,000 human genes to identify genes whose expression correlated with epithelial ovarian cancer. We extended current microarray technology by simultaneously hybridizing ovarian RNA samples in a highly parallel manner to a single glass wafer containing 49 individual oligonucleotide arrays separated by gaskets within a custom-built chamber (termed "array-of-arrays"). Hierarchical clustering of the expression data revealed distinct groups of samples. Normal tissues were readily distinguished from tumor tissues, and tumors could be further subdivided into major groupings that correlated both to histological and clinical observations, as well as cell type-specific gene expression. A metric was devised to identify genes whose expression could be considered ideal for molecular determination of epithelial ovarian malignancies. The list of genes generated by this method was highly enriched for known markers of several epithelial malignancies, including ovarian cancer. This study demonstrates the rapidity with which large amounts of expression data can be generated. The results highlight important molecular features of human ovarian cancer and identify new genes as candidate molecular markers.
Figures
References
-
- Gatta G, Lasota M B, Verdecchia A. Eur J Cancer. 1998;34:2218–2225. - PubMed
-
- Chuaqui R F, Cole K A, Emmert-Buck M R, Merino M J. Ann Diagn Pathol. 1998;2:195–207. - PubMed
-
- Niloff J M, Klug T L, Schaetzl E, Zurawski V R, Jr, Knapp R C, Bast R C., Jr Am J Obstet Gynecol. 1984;148:1057–1058. - PubMed
-
- Aunoble B, Sanches R, Didier E, Bignon Y J. Int J Oncol. 2000;16:567–576. - PubMed
MeSH terms
Substances
LinkOut - more resources
Full Text Sources
Other Literature Sources
Medical
Research Materials
Miscellaneous
