

Apparent diffusion coefficients in the evaluation of high-grade cerebral gliomas
- PMID: 11158889
- PMCID: PMC7975568
Apparent diffusion coefficients in the evaluation of high-grade cerebral gliomas
Abstract
Background and purpose: Preliminary data indicate that apparent diffusion coefficient (ADC) values may be useful in identifying and grading primary cerebral tumors. We tested the hypothesis that ADC values can be used to differentiate tumor, edema, and normal brain tissue.
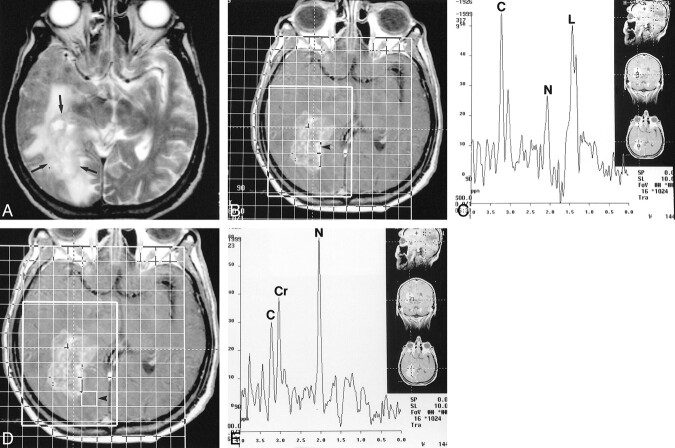
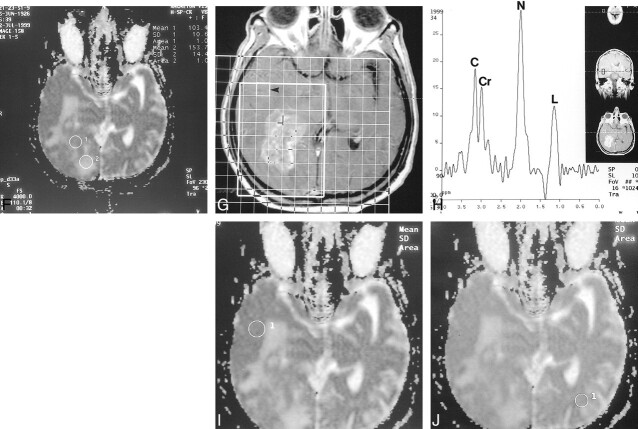
Methods: Fifteen patients with high-grade cerebral astrocytomas underwent conventional MR imaging, diffusion-weighted MR imaging, and proton MR spectroscopy. We defined tumor as an area containing the highest choline/creatine and choline/N-actetyl aspartate ratios, contrast enhancement, and abnormal T2 signal intensity. Edema was defined as tissue with normal proton MR spectra, no enhancement, and high T2 signal intensity. Normal brain was assumed if tissue had normal proton MR spectra, no enhancement, and normal T2 signal intensity in the hemispheres ipsilateral or contralateral to tumor. ADC maps were calculated and regions of interest were manually placed over areas of tumor, edema, and normal tissue. Comparisons were made by analysis of variance. For post hoc testing, the Tukey method was used to correct for the effect of multiple comparisons, and significance was accepted if P was less than .05.
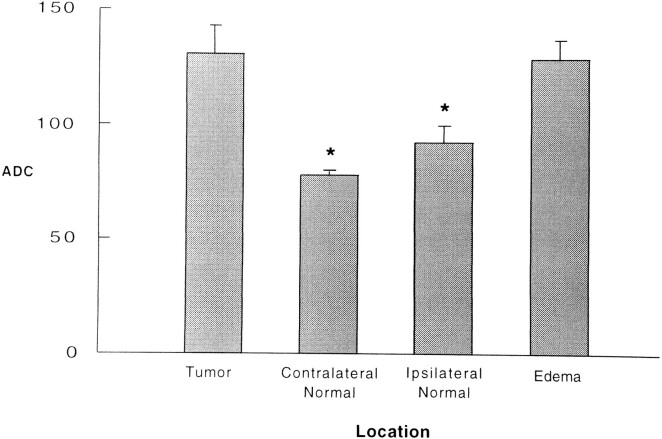
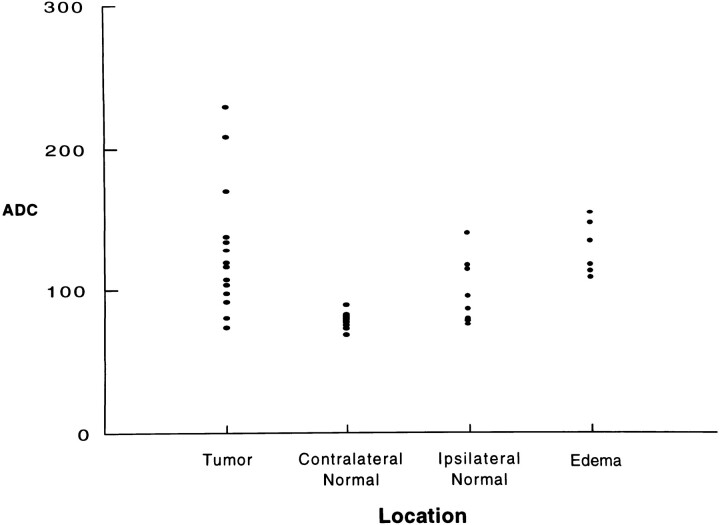
Results: When ADC values were analyzed as a group, significant differences were found between tumor (131 + 45) and normal brain tissue (ipsilateral to tumor, 92 + 22; contralateral to tumor, 78 + 5) but not between tumor and adjacent edema (129 + 45). A plot of individual data points showed considerable overlapping among the three types of tissue sampled.
Conclusion: As a group, ADC values helped to distinguish high-grade glioma from normal tissue but could not be used to separate high-grade glioma from surrounding edema. Individually, ADC values overlapped considerably and were not useful in our patients. The utility of ADC values (as obtained in this relatively small study) is questionable in patients with high-grade cerebral astrocytomas.
Figures
References
-
- Tien RD, Flesberg GJ, Friedman H, Brown M, MacFall J. MR imaging of high-grade cerebral gliomas: value of diffusion-weighted echoplanar pulse sequences. AJR Am J Roentgenol 1994;162:671-677 - PubMed
-
- Eis M, Els T, Hoehn-Berlage M, Hossman KA. Quantitative diffusion MR imaging of cerebral tumor and edema. Acta Neurochir 1999;60:344-346 - PubMed
-
- Eis M, Els T, Hoehn-Berlage M. High resolution quantitative relaxation and diffusion MRI of three different experimental tumors in rat. Magn Reson Med 1995;34:835-844 - PubMed
-
- Sugahara T, Korogi Y, Kochi M, et al. Usefulness of diffusion-weighted MRI with echo-planar technique in the evaluation of cellularity in gliomas. J Magn Reson Imaging 1999;9:53-60 - PubMed
-
- Gupta RK, Sinha U, Cloughesy TF, Alger JR. Inverse correlation between choline magnetic resonance spectroscopy signal intensity and the apparent diffusion coefficient in human glioma. Magn Reson Med 1999;41:2-7 - PubMed
Publication types
MeSH terms
LinkOut - more resources
Full Text Sources
Other Literature Sources
Medical
Research Materials