. 2001 Mar;183(5):1631-44.
doi: 10.1128/JB.183.5.1631-1644.2001.

Phylogenetic evidence for horizontal transfer of mutS alleles among naturally occurring Escherichia coli strains

Affiliations

Phylogenetic evidence for horizontal transfer of mutS alleles among naturally occurring Escherichia coli strains

E W Brown et al. J Bacteriol. 2001 Mar.

Abstract

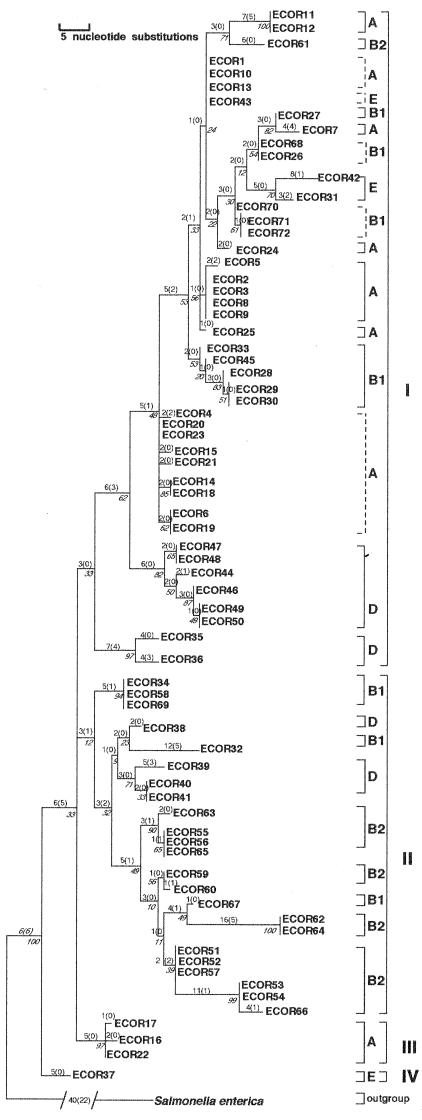
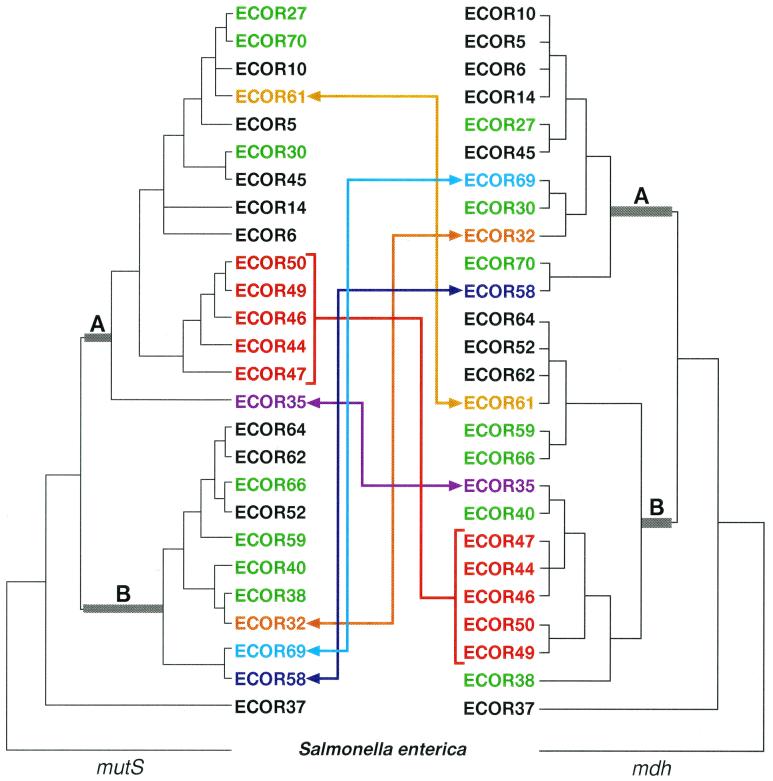
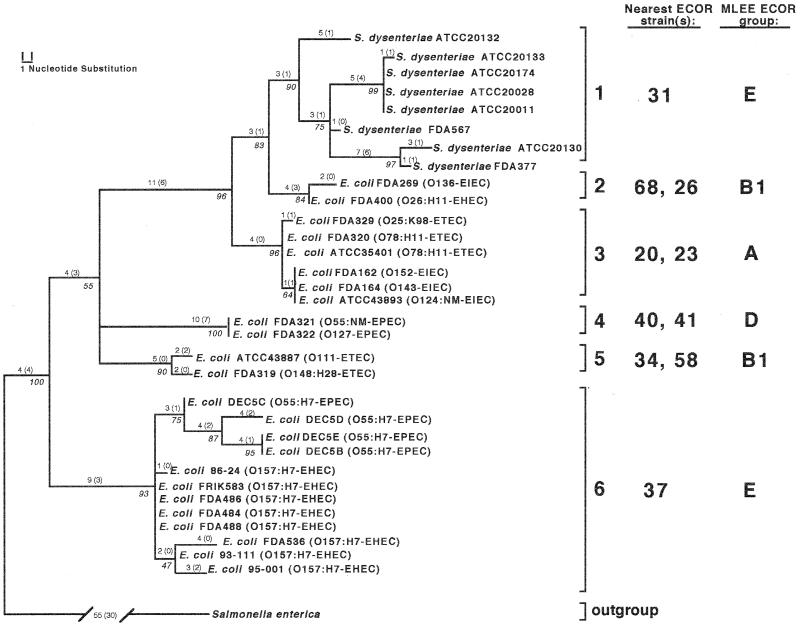
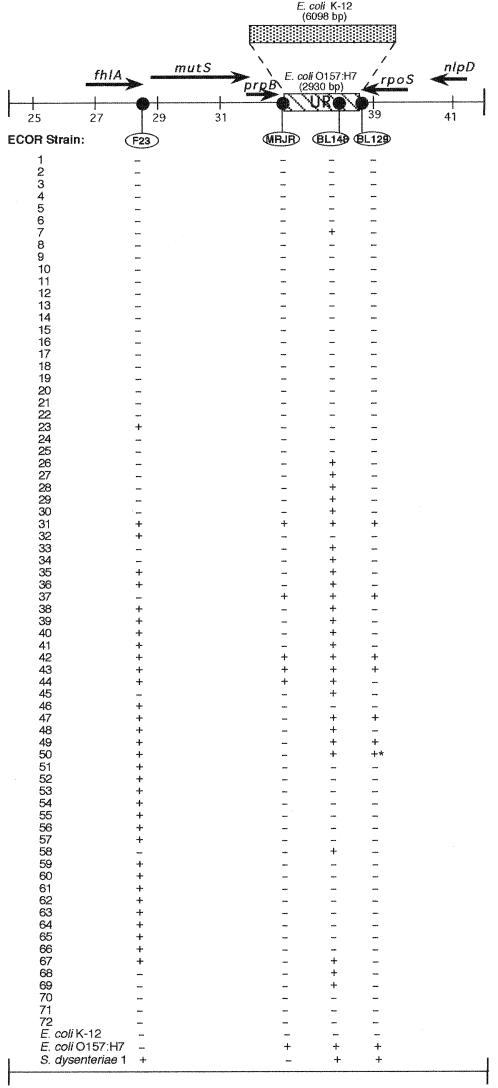
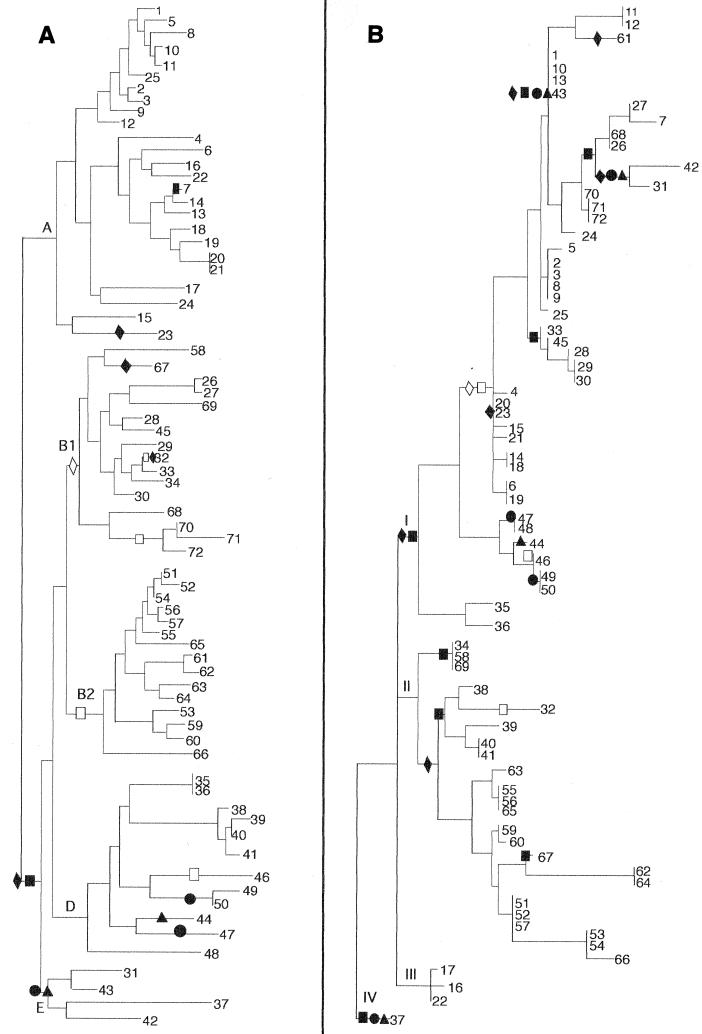
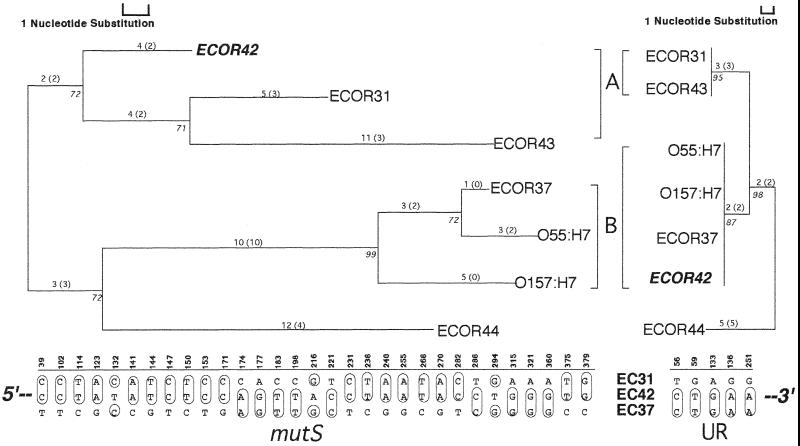
mutS mutators accelerate the bacterial mutation rate 100- to 1,000-fold and relax the barriers that normally restrict homeologous recombination. These mutators thus afford the opportunity for horizontal exchange of DNA between disparate strains. While much is known regarding the mutS phenotype, the evolutionary structure of the mutS(+) gene in Escherichia coli remains unclear. The physical proximity of mutS to an adjacent polymorphic region of the chromosome suggests that this gene itself may be subject to horizontal transfer and recombination events. To test this notion, a phylogenetic approach was employed that compared gene phylogeny to strain phylogeny, making it possible to identify E. coli strains in which mutS alleles have recombined. Comparison of mutS phylogeny against predicted E. coli "whole-chromosome" phylogenies (derived from multilocus enzyme electrophoresis and mdh sequences) revealed striking levels of phylogenetic discordance among mutS alleles and their respective strains. We interpret these incongruences as signatures of horizontal exchange among mutS alleles. Examination of additional sites surrounding mutS also revealed incongruous distributions compared to E. coli strain phylogeny. This suggests that other regional sequences are equally subject to horizontal transfer, supporting the hypothesis that the 61.5-min mutS-rpoS region is a recombinational hot spot within the E. coli chromosome. Furthermore, these data are consistent with a mechanism for stabilizing adaptive changes promoted by mutS mutators through rescue of defective mutS alleles with wild-type sequences.


Figures

FIG. 1
FIG. 1
Phylogenetic relationships of mutS alleles from 72 ECOR strains. The tree shown represents the strict consensus of eight equally parsimonious trees and has a tree length of 283 steps. Most parsimonious trees had a CI of 0.48 and an RI of 0.83. Measures of clade confidence are reported in italics below each node in the form of bootstrap values. The internal brackets to the right of each clade reflect monophyletic strain groupings with respect to the E. coli MLEE lineages A, B1, B2, D, and E. Broken internal brackets indicate groups of strains that formed polytomies on the tree and that are ambiguous with respect to strain polyphyly. The larger external brackets designate the four distinct clades derived from mutS sequences (denoted by roman numerals I to IV). Individual branch lengths are presented above each branch; the numbers of unambiguous substitutions that mapped to the tree only once are given in parentheses.
FIG. 2
FIG. 2
Phylogenetic comparisons of mutS and mdh among ECOR strains. The colored arrows mark the lateral movement of strains between distinct mutS and mdh clades (designated A and B). The two clades in which strains have been displaced are marked with thickened, gray-shaded basal branches. Strains depicted in green represent within-clade differences in the topology of the two trees. The red bracket denotes a group of strains that potentially acquired the same mutS allele. The gold, purple, navy, light blue, and orange arrows each connect an ECOR strain that has demonstrated interclade movement relative to the mutS and mdh phylogenies. The mutS tree was derived from the most parsimonious tree presented in Fig. 1, and the mdh tree was derived from a previously reported phylogeny (45). Both trees were rooted with S. enterica serovar Typhimurium as the outgroup.
FIG. 3
FIG. 3
Phylogenetic relationships of mutS nucleotide sequences from pathogenic E. coli and S. dysenteriae type 1. The tree shown represents the strict consensus of three equally parsimonious trees and has a tree length of 171 steps (CI = 0.71, RI = 0.89). Measures of clade confidence are reported in italics below each node in the form of bootstrap values. Individual branch lengths are presented above each branch, and the numbers of unambiguous substitutions that mapped to the tree only once are given in parentheses. The brackets to the right of the tree indicate the six distinct clades of pathogenic strains (1 to 6). The nearest ECOR strain(s) based on mutS relationships and the MLEE ECOR group designation is listed to the right of each bracketed clade.
FIG. 4
FIG. 4
Distribution of four mutS-rpoS region sequences among ECOR strains. The schematic shows the genetic organization of the E. coli chromosome from 61 to 62 min. The bold arrows show the length and direction of the coding regions of the genes indicated. The UR of E. coli O157:H7 and corresponding region in E. coli K-12 are shown, with their sizes given in parentheses. The four probes employed in colony hybridization studies are indicated in ovals and are positioned to show their relative locations on the chromosome. The presence (+) or absence (−) of a sequences is given below each probe for 72 ECOR strains, E. coli O157:H7 and K-12, and S. dysenteriae type 1. The asterisk marks a weakly positive reaction. The map is scaled in 2,000-bp increments based on sequence coordinates of the E. coli K-12 sequence contig Ecu29579, available in GenBank.
FIG. 5
FIG. 5
Phylogenetic distributions of four mutS-rpoS region sequences mapped onto E. coli MLEE and mutS phylogenies. Hybridization data were optimized on the (A) MLEE and (B) mutS trees according to the principle of maximum parsimony. The optimization scheme shown represents the most parsimonious scenario for the evolution of these four sequences. In clades for which equally parsimonious optimizations exist, the accelerated transformation scheme is presented (21). Probe sequences are represented on the trees by the following symbols: ▴, MRJR; ●, BL129; ■, BL148; and ⧫, F23. The presence of a symbol represents a single evolutionary transformation (step). Shaded symbols represent the gain of specific sequences along the indicated lineage, while open symbols mark the loss of the sequence from a clade.
FIG. 6
FIG. 6
Phylogenetic evidence for a crossover between mutS and the adjacent UR in E. coli. The trees shown represent the most parsimonious phylogenies for mutS and UR among the seven ECOR strains known to possess both mutS and intact prpB-UR junction sequences. The mutS tree shown had a length of 63 steps (CI = 0.76, RI = 0.71). The UR had a length of 12 steps (CI = 1.00, RI = 1.00). The distribution of nucleotide substitutions that gave rise to the topologies is given below each tree for ECOR (EC) strains 31, 42, and 37, and these illustrate the shift in genetic similarities for ECOR42 across the two regions. The numbers above each substitution show the exact position in the Clustal X sequence alignment. The trees shown were midpoint rooted.

References

    1. Barcus V A, Titheradge A J B, Murray N E. The diversity of alleles at the hsd locus in natural populations of Escherichia coli. Genetics. 1995;140:1187–1197. - PMC - PubMed
    1. Bingen E, Picard B, Brahimi N, Mathy S, Desjardins P, Elion J, Denamur E. Phylogenetic analysis of Escherichia coli strains causing neonatal meningitis suggests horizontal gene transfer from a predominant pool of highly virulent B2 strains. J Infect Dis. 1998;177:642–50. - PubMed
    1. Bisercic M, Feutrier J Y, Reeves P R. Nucleotide sequence of the gnd genes from nine natural isolates of Escherichia coli: evidence of intragenic recombination as a contributing factor in the evolution of the polymorphic gnd locus. J Bacteriol. 1991;173:3894–3900. - PMC - PubMed
    1. Boyd E F, Hartl D L. Chromosomal regions specific to pathogenic isolates of Escherichia coli have a phylogenetically clustered distribution. J Bacteriol. 1998;180:1159–1165. - PMC - PubMed
    1. Boyd E F, Hill C W, Rich S M, Hartl D L. Mosaic structure of plasmids from natural populations of Escherichia coli. Genetics. 1996;143:1091–1100. - PMC - PubMed

LinkOut - more resources