. 2001 Feb;107(3):351-62.
doi: 10.1172/JCI9940.

Inhibition of STAT3 signaling leads to apoptosis of leukemic large granular lymphocytes and decreased Mcl-1 expression

Affiliations

Inhibition of STAT3 signaling leads to apoptosis of leukemic large granular lymphocytes and decreased Mcl-1 expression

P K Epling-Burnette et al. J Clin Invest. 2001 Feb.

Abstract

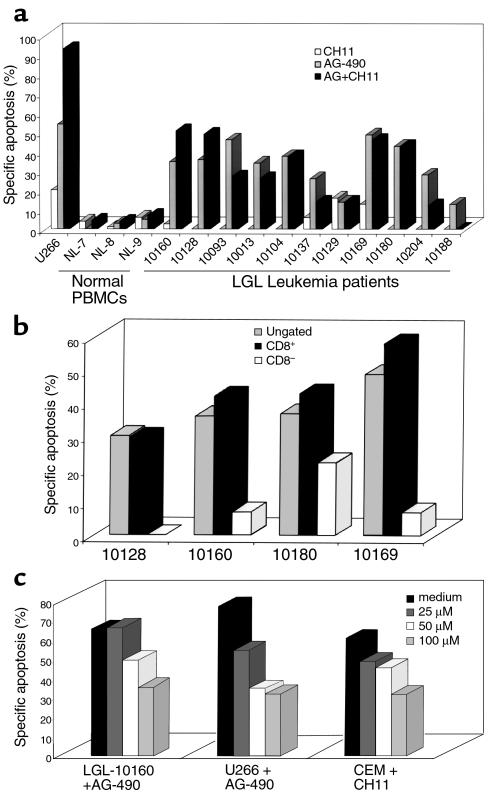
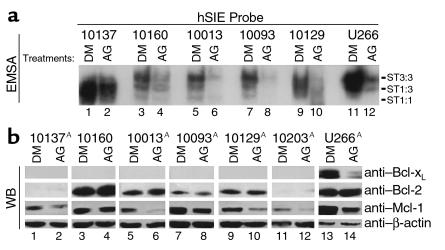
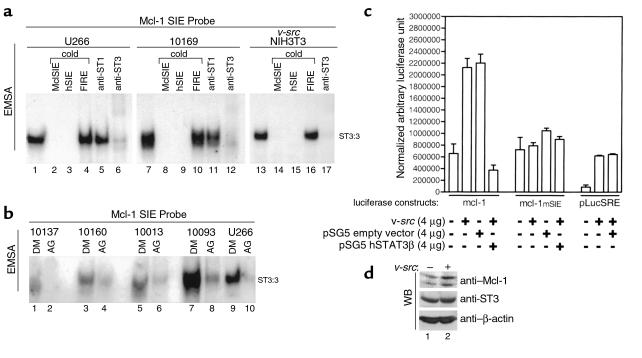
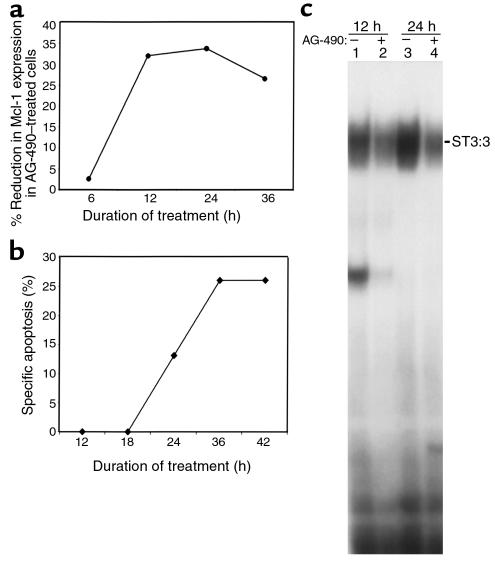
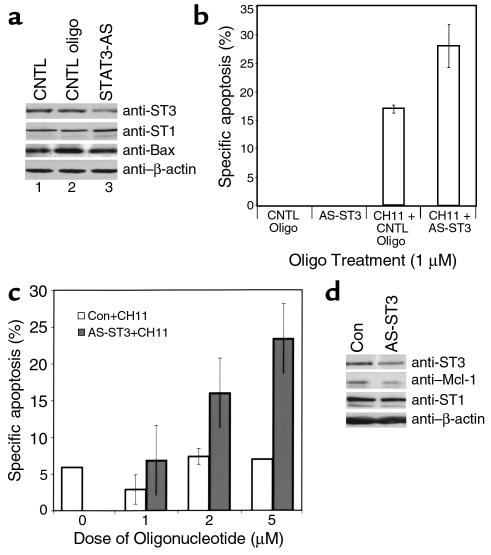
Large granular lymphocyte (LGL) leukemia is characterized by the expansion of antigen-activated cytotoxic T lymphocytes. These leukemic cells are resistant to Fas-mediated apoptosis despite expressing high levels of Fas. We found that leukemic LGL from 19 patients displayed high levels of activated STAT3. Treatment of leukemic LGL with the JAK-selective tyrosine kinase inhibitor AG-490 induced apoptosis with a corresponding decrease in STAT-DNA binding activity. Moreover, using an antisense oligonucleotide approach to diminish STAT3 expression, we found that Fas sensitivity was restored in leukemic LGL. AG-490-induced apoptosis in leukemic LGL was independent of Bcl-xL or Bcl-2 expression. However, we found that the Bcl-2-family protein Mcl-1 was significantly reduced by AG-490 treatment. Activated STAT3 was shown to bind an SIE-related element in the murine mcl-1 promoter. Using a luciferase reporter assay, we demonstrated that v-src overexpression in NIH3T3 induced STAT3-dependent transcriptional activity from the mcl-1 promoter and increased endogenous Mcl-1 protein levels. We conclude that STAT3 activation contributed to accumulation of the leukemic LGL clones. These findings suggest that investigation should focus on novel strategies targeting STAT3 in the treatment of LGL leukemia.


Figures

Figure 1
Figure 1
Activation of STAT3 and STAT1 in leukemic LGLs. (a) EMSA with nuclear extracts from PBMCs of normal donors (NL), from normal donors activated for 7 days with PHA + IL-2 (NL-AC), and from patients with LGL leukemia (LGL). Cytoplasmic extracts from each sample were run on an SDS-PAGE gel and blotted for expression of STAT3. (b) EMSA supershift or blocking experiments with untreated (lanes 1, 4, 7, 10, and 13), anti-STAT1–preincubated (lanes 2, 5, 8, 11, and 14), and anti-STAT3–preincubated (lanes 3, 6, 9, 12, and 15) reaction mixtures. (c) Western blot analysis of whole-cell extracts for phosphorylated STAT3, total STAT3, and β-actin. (d) EMSA for STAT5-DNA–binding activity with activated normal and leukemic LGLs (10024-AC) used as a positive control. The relative migration of STAT3:3 homodimers (ST3:3), STAT1:3 heterodimers (ST1:3), and STAT1:1 homodimers (ST1:1) is shown in a and b. (d) STAT5:5 homodimers (ST5:5) and STAT1:1 homodimers (ST1:1) are indicated. WB, Western blot.
Figure 2
Figure 2
AG-490 induction of apoptosis in leukemic LGLs. (a) Analysis of apoptosis was assessed by annexin-V-FITC and 7-AAD binding in PBMCs isolated from a patient with LGL leukemia (no. 10160; row 1), from a normal unactivated donor (NL-7; row 2), from activated normal PBMCs (NL-7AC; row 3) or from the U266 cell line (row 4). Cells were treated with DMSO + mouse IgM (drug solvent; column 1), anti-Fas agonistic antibody (CH11; column 2), 50 μM of AG-490 + mouse IgM (column 3), or AG-490 in combination with CH11 (column 4). The average percent of annexin-V-FTIC–positive cells and SD of two separate experiments is shown in the upper right corner of the histogram. (b) Annexin-V-FITC binding of leukemic LGL and normal PBMCs in response to DMSO (0) and AG-490 (25, 50, and 100 μM for 48 hours). The percent specific apoptosis is indicative of three separate experiments using the same patient. AStatistically significant; P < 0.05 using a Student’s t test. P value of normal unactivated PBMCs with 100 μM approached significance (P = 0.06).
Figure 3
Figure 3
AG-490 consistently induced annexin-V-FITC binding in leukemic LGLs but not sensitization of Fas. (a) The percent specific apoptosis was calculated for normal PBMCs (NL), leukemic LGLs (patient number), and U266 cells after treatment with DMSO. Open bars, anti-Fas (CH11); gray bars, 50 μM AG-490 (AG); filled bars, AG-490 with CH11. These results were representative of at least two experiments for each patient, and the assay was performed in duplicate. The only exception was patient 10129, for whom the procedure was done only once because therapy was soon initiated. AG-490–induced apoptosis in leukemic LGLs was statistically significant with P < 0.05 by ANOVA. (b) Three-color FACS analyses were performed on PBMCs from three patients with LGL leukemia. The patient’s cells were first stained with an isotype control antibody-PE or anti–CD8-PE before staining with annexin-V FITC and 7-AAD. A live gate was used to collect either the CD8+ cells or the CD8 cells, and then apoptosis was assessed (c). AG-490 was added to leukemic LGLs (patient 10160), and U266 cells or CH11 was added to CEM after pretreatment with medium (filled bars), or the caspase-3 inhibitor Ac-DEVD-fmk at doses of 25 μM (dark gray bars), 50 μM (open bars), and 100 μM (light gray bars). The data are shown as percent specific apoptosis and were performed in duplicate.
Figure 4
Figure 4
AG-490–reduced DNA-binding activity of STAT3 and expression of Mcl-1. (a) EMSA with leukemic LGLs (lanes 1–10) or U266 (lanes 11 and 12) treated with DMSO (DM; lanes 1, 3, 5, 7, 9, and 11) or AG-490 (lanes 2, 4, 6, 8, 10, and 12). The relative position of STAT3:3 homodimers (ST3:3), STAT1:3 heterodimers (ST1:3), and STAT1:1 homodimers (ST1:1) is indicated. The results are shown for five patients with LGL leukemia and are representative of three separate experiments. A statistically significant decrease in EMSA binding occurred in all AG-490–treated cells tested compared with DMSO (P < 0.05 using Student’s t test.) (b) Western blot analysis for expression of Bcl-xL, Bcl-2, Mcl-1, and β-actin. Ten micrograms of total protein was used for U266 cells and 25 μg for leukemic LGLs. Samples were analyzed on 10% SDS-PAGE gel. The results shown are representative of three separate experiments. AStatistically significant decrease in Mcl-1 expression after AG-490 treatment; P < 0.05 using Student’s t test.
Figure 5
Figure 5
STAT3 DNA-binding to an SIE-like element in the Mcl-1 promoter and transcription regulation. (a) EMSA was performed using nuclear extracts from U266 (lanes 1–6), leukemic LGLs (patient 10169; lanes 7–12), and v-src–transformed NIH3T3 (lanes 13–17) with the Mcl-1 SIE probe labeled with P32. Competition assays were performed by adding excess cold oligonucleotide (×100) for MclSIE (lanes 2, 8, and 14), hSIE (lanes 3, 9, and 15), and nonspecific competitor (FIRE, lanes 4, 10, and 16). Blocking or supershift analysis was performed by adding anti-STAT1 antibody (lanes 5 and 11) or anti-STAT3 antibody (lanes 6, 12, and 17), respectively. (b) EMSA analysis with mcl-1 SIE using nuclear extracts of leukemic LGLs (lanes 1–8) or U266 (lanes 9 and 10) treated with solvent control (DMSO, lanes 1, 3, 5, 7, and 9) or AG-490 (lanes 2, 4, 6, 8, and 10). Results shown are representative of two experiments. (c) Transcriptional analysis was performed by transfection of NIH3T3 with 4 μg of pGL2 mcl-1 (p-203/+10mcl-luc), pGL2 mSIE mcl-1 (p-203/+10mS), and pLucSRE-luciferase alone or in combination with 4 μg v-src, pSG5-STAT3β, and pSG5 vector control expression vectors. The values shown are normalized by cotransfection with CMV-β–galactosidase expression vectors. (d) Western blot analysis in NIH3T3 without (–) or with (+) v-src overexpression for Mcl-1, STAT3, and β-actin protein expression.
Figure 6
Figure 6
Kinetic analysis with AG-490 treatment. Leukemic LGLs were treated with DMSO or AG-490 for 6, 12, 24, and 36 hours. (a) Graphic representation of the percent reduction in Mcl-1 expression in AG-490–treated cells in comparison with DMSO-treated cells. Mcl-1 protein expression was normalized to β-actin by densitometry using the ImageQuant program (Molecular Dynamics). (b) Degree of annexin-V-FITC–positive binding with percent specific apoptosis, calculated as described in Methods, in leukemic LGLs treated for 12, 18, 24, 36, and 42 hours in DMSO and AG-490. (c) EMSA for STAT3 activity with DMSO-treated (–) or AG-490–treated (+) cells after 12 and 24 hours. Data shown are representative of results in two patients. The apoptosis assay was performed in duplicate in each patient.
Figure 7
Figure 7
Sensitivity to Fas and reduced expression of Mcl-1 in leukemic LGLs treated with antisense STAT3. Leukemic LGLs (patient 10160) were incubated with medium (CNTL), 1 μM control oligonucleotide (CNTL oligo), or 1 μM antisense STAT3 oligonucleotide. (a) Western blot analysis for STAT3, STAT1, Bax, and β-actin expression. (b) Annexin-V-FITC binding was determined in the presence (CH11+) or absence of agonistic anti-Fas antibody. Data shown are calculations of percent specific apoptosis of the average results obtained in duplicate reactions. (c) Specific apoptosis calculated for control (open bars) or antisense STAT3 oligonucleotide (filled bars) in the absence (0) or presence of 1, 2, and 5 μM oligonucleotides (patient 10205). (d) Western blot analysis in the presence of 2 μM control oligonucleotide (Con) or antisense STAT3 oligonucleotide (AS-ST3) for expression of STAT3, Mcl-1, STAT1, and β-actin protein.

References

    1. Loughran TP., Jr Clonal diseases of large granular lymphocytes. Blood. 1993; 82:1–14. - PubMed
    1. Semenzato G, Zambello R, Starkebaum G, Oshimi K, Loughran TP., Jr The lymphoproliferative disease of granular lymphocytes: updated criteria for diagnosis. Blood. 1997; 89:256–260. - PubMed
    1. Oshimi K, Shinkai Y, Okumura K, Oshimi Y, Mizoguchi H. Perforin gene expression in granular lymphocyte proliferative disorders. Blood. 1990; 75:704–708. - PubMed
    1. Van Parijs L, Ibraghimov A, Abbas AK. The roles of costimulation and Fas in T cell apoptosis and peripheral tolerance. Immunity. 1996; 4:321–328. - PubMed
    1. Spaner D, Raju K, Radvanyi L, Lin Y, Miller RJ. A role for perforin in activation-induced cell death. J Immunol. 1998; 160:2655–2664. - PubMed

Publication types

MeSH terms