. 2001 Feb;107(3):379-86.
doi: 10.1172/JCI10660.

Melanin-concentrating hormone overexpression in transgenic mice leads to obesity and insulin resistance

Affiliations

Melanin-concentrating hormone overexpression in transgenic mice leads to obesity and insulin resistance

D S Ludwig et al. J Clin Invest. 2001 Feb.

Abstract

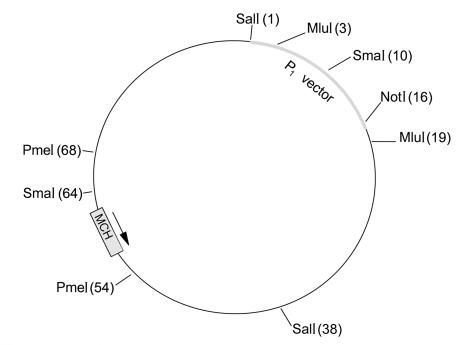
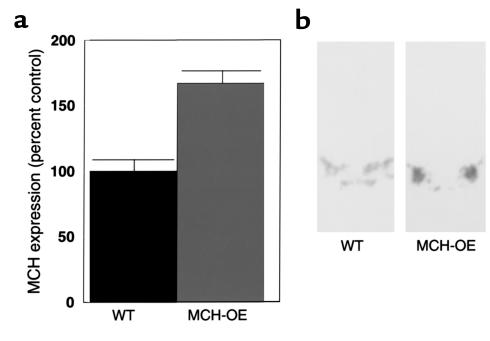
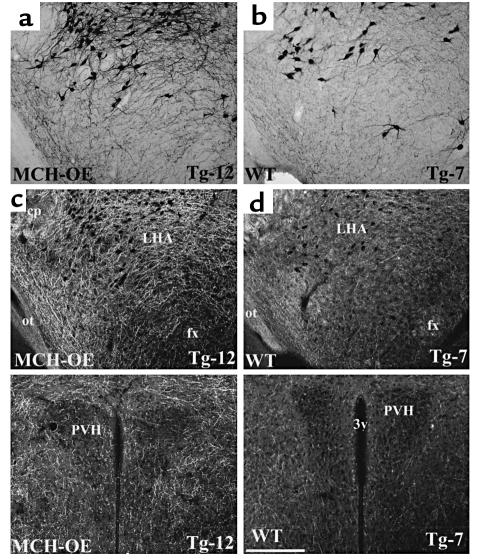
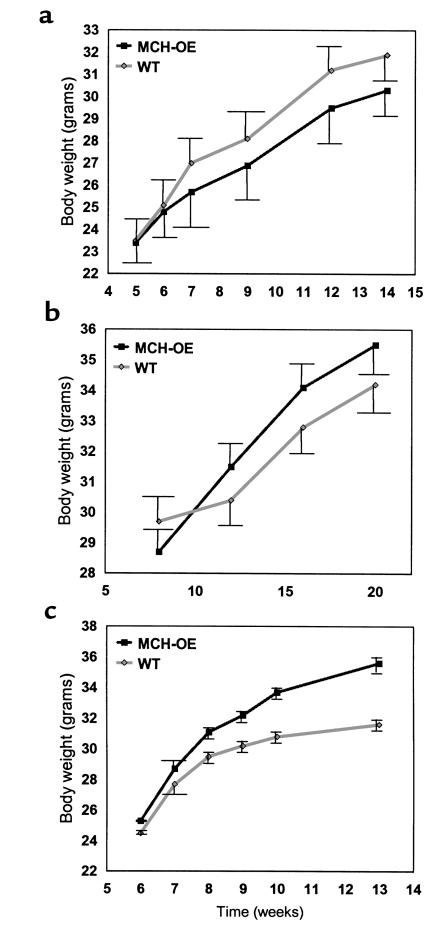
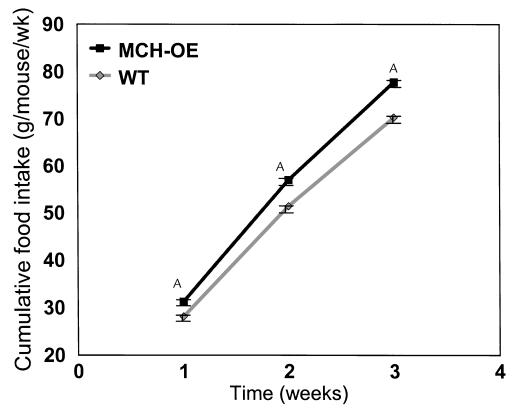
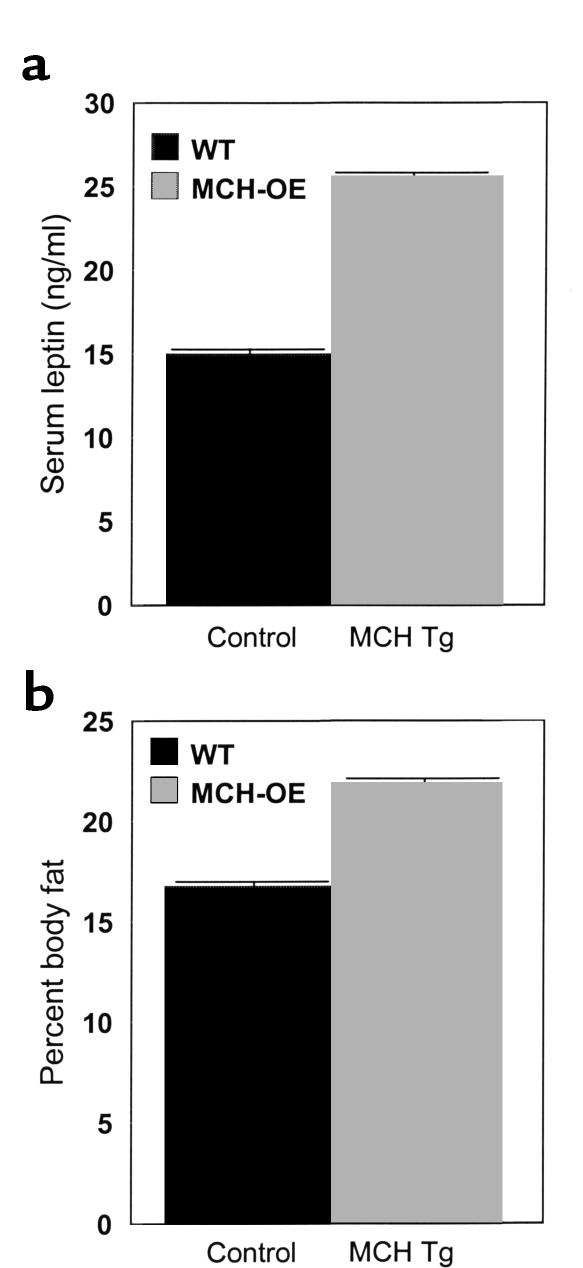
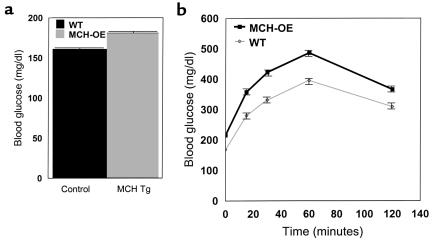
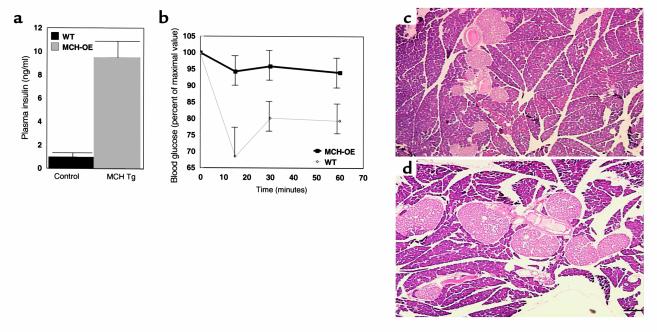
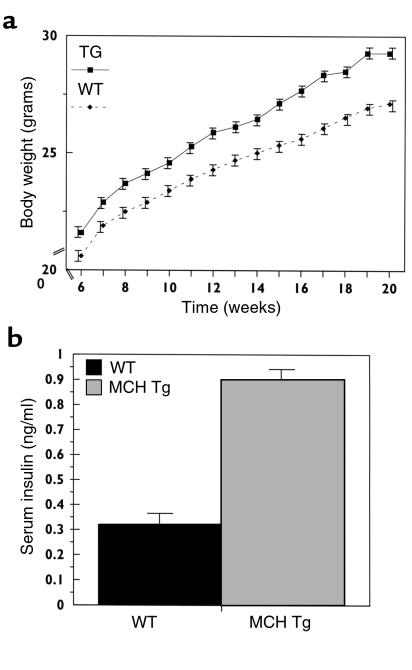
Several lines of investigation suggest that the hypothalamic neuropeptide melanin-concentrating hormone (MCH) regulates body weight in mammals. Obese mice lacking functional leptin overexpress the MCH message in the fed or fasted state. Acute intracerebroventricular injection of MCH increases energy intake in rats. Mice lacking the MCH gene are lean. To test the hypothesis that chronic overexpression of MCH in mice causes obesity, we produced transgenic mice that overexpress MCH (MCH-OE) in the lateral hypothalamus at approximately twofold higher levels than normal mice. On the FVB genetic background, homozygous transgenic animals fed a high-fat diet ate 10% more and were 12% heavier at 13 weeks of age than wild-type animals, and they had higher systemic leptin levels. Blood glucose levels were higher both preprandially and after an intraperitoneal glucose injection. MCH-OE animals were insulin-resistant, as demonstrated by markedly higher plasma insulin levels and a blunted response to insulin; MCH-OE animals had only a 5% decrease in blood glucose after insulin administration, compared with a 31% decrease in wild-type animals. MCH-OE animals also exhibited a twofold increase in islet size. To evaluate the contribution of genetic background to the predisposition to obesity seen in MCH-OE mice, the transgene was bred onto the C57BL/6J background. Heterozygote C57BL/6J mice expressing the transgene showed increased body weight on a standard diet, confirming that MCH overexpression can lead to obesity.


Figures

Figure 1
Figure 1
Restriction analysis map of the MCH-containing P1 clone used in the generation of the MCH transgene. The position of restriction sites is shown as number of kilobases of DNA (in parentheses).
Figure 2
Figure 2
Overexpression of MCH mRNA in the lateral hypothalamic area of MCH-transgenic mice is demonstrated by Northern blot analysis (P < 0.01) (a) and in situ hybridization (b). WT, wild-type.
Figure 3
Figure 3
(a and b) A series of bright-field photomicrographs demonstrate MCH-immunoreactive neurons in the lateral hypothalamic area (LHA) in the brain (a) of an MCH-OE mouse (mouse Tg-12) and in the corresponding hypothalamic area in the brain (b) of a wild-type mouse (mouse Tg-7), showing a visually evident increase in MCH immunostaining in neurons of the MCH-OE mouse in comparison with the wild-type mouse. (c and d) A series of dark-field photomicrographs demonstrate the distribution of MCH-immunoreactive fibers in the LHA in the brain (c) of an MCH-transgenic mouse (mouse Tg-12) and in the corresponding hypothalamic area in the brain (d) of a wild-type mouse (mouse Tg-7). Within the LHA, the MCH-immunoreactive cell bodies are distributed in similar patterns in the MCH-OE and wild-type brains (c and d). However, note the visually apparent increase in MCH immunoreactivity in the LHA (c and d). There is also visually evident increase in MCH immunoreactivity surrounding the paraventricular hypothalamic nucleus (PVH) in the MCH-OE brain (bottom left panel) compared with the wild-type brain (bottom right panel). Scale bar, 200 μm. cp, cerebral peduncle; fx, fornix; ot, optic tract; 3v, third ventricle.
Figure 4
Figure 4
Weight curve of male MCH-transgenic heterozygotes on high-fat diet (a) shows no significant increase in body weight of MCH heterozygotes (P = NS, repeated measures ANOVA). Male MCH-transgenic homozygotes on standard diet (b) show no significant increase (P = NS, repeated measures ANOVA) in body weight. Male MCH-transgenic homozygotes on a high-fat diet (c) show a significant increase (P < 0.001, repeated measures ANOVA) in body weight.
Figure 5
Figure 5
Food intake of male MCH transgenic homozygotes on high-fat diet, showing an approximately 10% increase in food intake (P < 0.001 for the comparisons at weeks 1, 2, and 3) in these animals compared with wild-type mice. ASignificant difference.
Figure 6
Figure 6
Serum leptin (a) and percentage of body fat (b) in male MCH transgenic homozygote mice, showing a significant (approximately twofold, P < 0.001) increase in serum leptin and percentage of body fat (approximately 31%, P = 0.02) in male MCH-transgenic homozygotes placed on high-fat diet.
Figure 7
Figure 7
Fed blood glucose (a) and intraperitoneal glucose-tolerance test (b) in male MCH transgenic homozygote mice placed on a high-fat diet, showing significantly higher fed blood glucose (P = 0.003) and impaired glucose tolerance (P = 0.002, repeated measures ANOVA) in the MCH-transgenic homozygotes.
Figure 8
Figure 8
Fed plasma insulin (a), insulin-tolerance test (b), and pancreatic islet cell histology (c and d) in male control animals. Plasma insulin was approximately tenfold higher (P < 0.001) in MCH-transgenic mice, which showed insulin resistance on insulin-tolerance testing (P < 0.001, repeated measures ANOVA). Representative sections of pancreas showed that when compared with control animals (c), MCH-transgenic mice had a twofold increase in islet size (d) (P < 0.02).
Figure 9
Figure 9
Weight curves (a) and serum insulin levels (b) of male MCH-transgenic heterozygotes back-bred on C57BL/6J background for seven generations. These MCH-OE mice showed a significant increase (P = 0.002, repeated measures ANOVA) in body weight on a standard (6% fat) diet. Serum insulin levels were increased threefold (P = 0.009) in the MCH-OE mice in comparison with wild-type mice.

References

    1. Flier JS, Maratos-Flier E. Obesity and the hypothalamus: novel peptides for new pathways. Cell. 1998; 92:437–440. - PubMed
    1. Tritos NA, Maratos-Flier E. Two important systems in energy homeostasis: melanocortins and melanin-concentrating hormone. Neuropeptides. 1999; 33:339–349. - PubMed
    1. Qu D, et al. A role for melanin-concentrating hormone in the central regulation of feeding behaviour. Nature. 1996; 380:243–247. - PubMed
    1. Ludwig DS, et al. Melanin-concentrating hormone: a functional melanocortin antagonist in the hypothalamus. Am J Physiol. 1998; 274:E627–E633. - PubMed
    1. Bittencourt JC, et al. The melanin-concentrating hormone system of the rat brain: an immuno- and hybridization histochemical characterization. J Comp Neurol. 1992; 319:218–245. - PubMed

Publication types

MeSH terms