. 2001 Feb 15;21(4):1137-47.
doi: 10.1523/JNEUROSCI.21-04-01137.2001.

G-protein inhibition of N- and P/Q-type calcium channels: distinctive elementary mechanisms and their functional impact

Affiliations

G-protein inhibition of N- and P/Q-type calcium channels: distinctive elementary mechanisms and their functional impact

H M Colecraft et al. J Neurosci. .

Erratum in

  • J Neurosci 2001 Mar 15;21(6):1a

Abstract

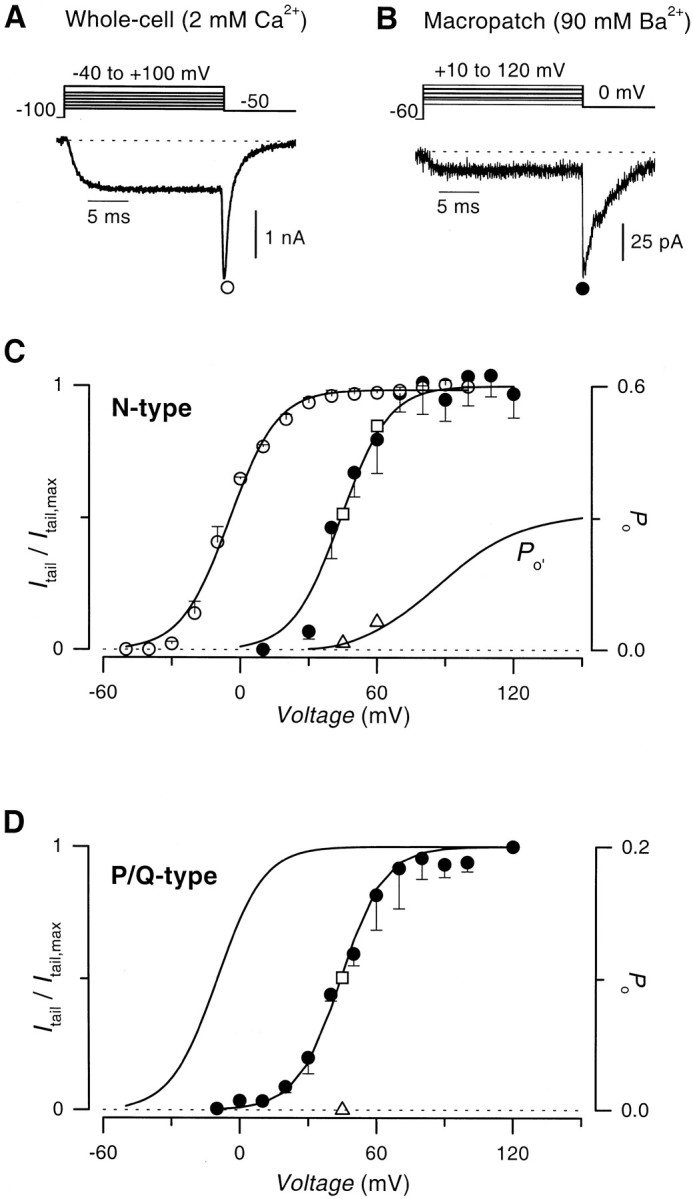
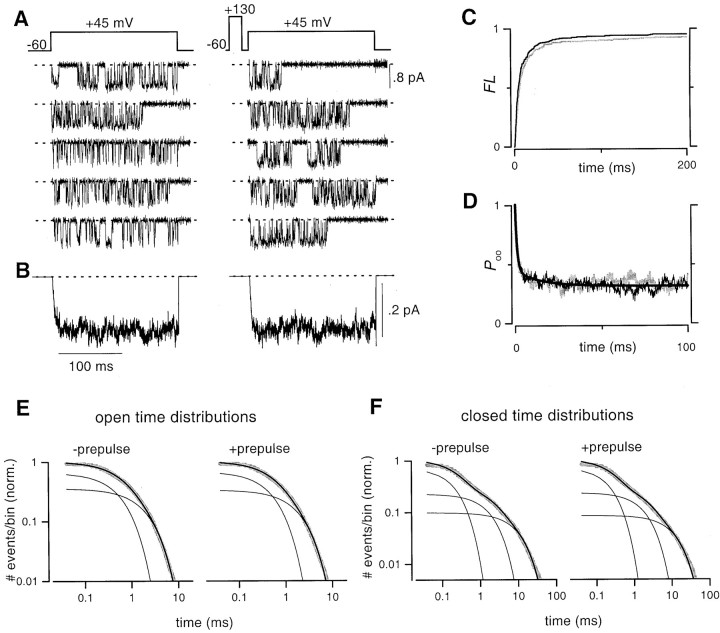
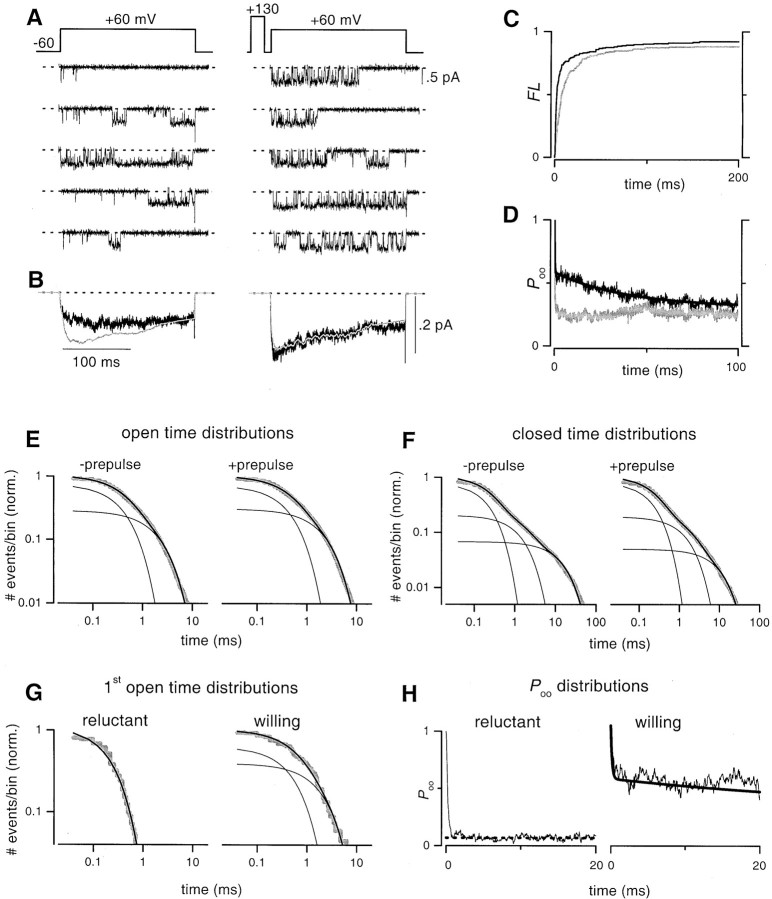
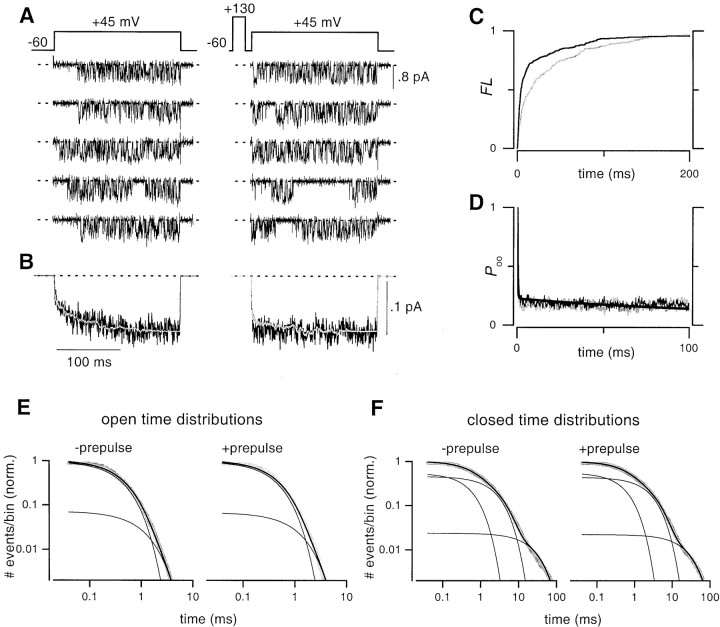
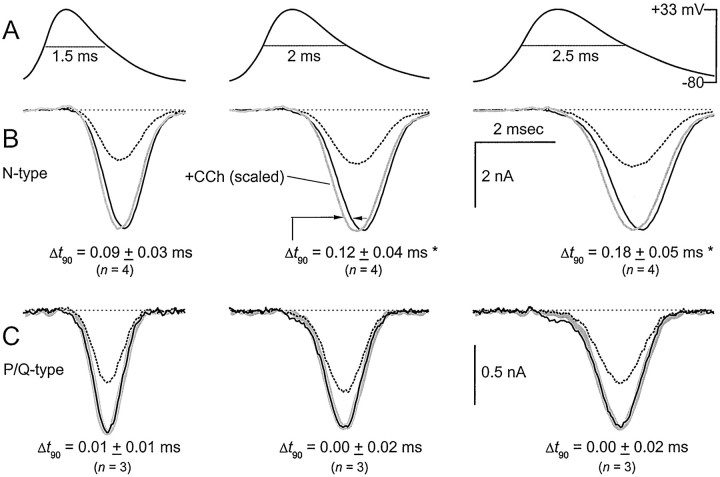
Voltage-dependent G-protein inhibition of presynaptic Ca(2+) channels is a key mechanism for regulating synaptic efficacy. G-protein betagamma subunits produce such inhibition by binding to and shifting channel opening patterns from high to low open probability regimes, known respectively as "willing" and "reluctant" modes of gating. Recent macroscopic electrophysiological data hint that only N-type, but not P/Q-type channels can open in the reluctant mode, a distinction that could enrich the dimensions of synaptic modulation arising from channel inhibition. Here, using high-resolution single-channel recording of recombinant channels, we directly distinguished this core contrast in the prevalence of reluctant openings. Single, inhibited N-type channels manifested relatively infrequent openings of submillisecond duration (reluctant openings), which differed sharply from the high-frequency, millisecond gating events characteristic of uninhibited channels. By contrast, inhibited P/Q-type channels were electrically silent at the single-channel level. The functional impact of the differing inhibitory mechanisms was revealed in macroscopic Ca(2+) currents evoked with neuronal action potential waveforms (APWs). Fitting with a change in the manner of opening, inhibition of such N-type currents produced both decreased current amplitude and temporally advanced waveform, effects that would not only reduce synaptic efficacy, but also influence the timing of synaptic transmission. On the other hand, inhibition of P/Q-type currents evoked by APWs showed diminished amplitude without shape alteration, as expected from a simple reduction in the number of functional channels. Variable expression of N- and P/Q-type channels at spatially distinct synapses therefore offers the potential for custom regulation of both synaptic efficacy and synchrony, by G-protein inhibition.


Figures

Fig. 1.
Fig. 1.
Magnitude of surface potential shift in cell-attached recordings of calcium channel activity, with 90 mm Ba2+ as charge carrier.A,Top, Voltage protocol.Bottom, Exemplar N-type channel whole-cell tail current evoked after a step depolarization to +10 mV, with 2 mmCa2+ as charge carrier. B, Top, Voltage protocol. Bottom, Exemplar N-type channel macropatch tail current obtained in a cell-attached recording, with 90 mm Ba2+ as charge carrier. Displayed tail current was evoked after a step depolarization to +50 mV.C, Comparison of N-type channel whole-cell (open circles) or cell-attached macropatch (filled circles) tail activation (G–V) curves. Smooth curves through the data are least-squares single Boltzmann fits with the following parameters: whole-cell (V1/2, −4.9 mV; slope factor, 9.8), macropatch (V1/2, +44 mV; slope factor, 9.8). In single-channel recordings (with 90 mmBa2+), the Po of the N-type channel was 0.31 at +45 mV and 0.51 at +60 mV (Figs.2B, 4B, respectively, + prepulse). Values (open square) were used to calibrate the macropatchG–V curve in terms of absolutePo of the N-type channel (right axis). The curve representing the reluctant N-type channel open probability, Po′, was obtained as the product of a previous whole-cell estimate ofPo′/Po (corrected for a surface charge shift of +50 mV) (Colecraft et al., 2000) and the absolute Po curve described here. ActualPo′ values measured from single-channel recordings in this study (open triangles) were obtained from the product of the steady-state Poovalues of reluctant gating (Figs. 3H, 4H), and the plateau values of FLafter prepulse, which expressly takes into account blank sweeps (Figs.3C, 4C). This calculation assumes the same fraction of blank sweeps for reluctant and willing channels, as suggested from the convergence of FL curves (Figs.3C, 4C), despite persistence of reluctant gating throughout many sweeps (e.g., Fig. 3A, sweeps2 and 5). D, P/Q-type channel whole-cell and cell-attached macropatch (filled circles) G–V curves constructed as in C, for the N-type channel. The single Boltzmann fit to the whole-cell tail current data are reproduced here (C. D. DeMaria, H. M. Colecraft, and D. T. Yue, unpublished observations). Least-squares fits had the following parameters: whole-cell (V1/2, −9.8 mV; slope factor, 9.4), cell-attached macropatch (V1/2, +44.3 mV; slope factor, 9.4). The measured single-channel Po of the P/Q-channel at +45 mV was 0.1 (Fig. 5), and this value (open square) was used to calibrate the macropatchG–V curve in terms of absolutePo (right axis).Po′ at +45 mV was zero (triangle), as shown in Figure 5.
Fig. 2.
Fig. 2.
Baseline single-channel gating characteristics of recombinant N-type channels. A,Top,Voltage protocol. Test pulses without (left) or with (right) a prepulse were interleaved.Bottom, Representative unitary current activity from a patch containing a single N-type channel. Here and throughout, representative records are not consecutive, and dotted lines represent the zero current level, unless otherwise stated. The mean unitary current amplitude was 0.65 ± 0.05 pA (n = 3). B, Ensemble average currents averaged from three patches. Here and throughout, ensemble currents were averaged from all sweeps, including nulls.C,FL distributions obtained either without (gray trace) or with (black trace) a prepulse. D, Conditional open probability distributions, Poo, obtained without (gray trace) or with (black trace) a prepulse. Smooth curve is a least-squares fit of a biexponential function to the no prepulse data. E, Open time distribution histograms of N-type channels obtained either without (left), or with (right) a prepulse. The number of openings with duration more than or equal to the time interval on the x-axis was normalized by the total number of openings estimated from maximum likelihood fits [yielding # events/bin (norm.)], and plotted on log–log coordinates with bin width fixed at 40 μsec throughout. Maximum likelihood fits to the data had the following parameters: −prepulse (τ1= 0.61 msec, 66%; τ2 = 2.2 msec, 34%; 10, 086 total events), +prepulse (τ1 = 0.55 msec, 68%;τ2 = 2.09 msec, 32%; 10, 440 events). F, Closed time distribution histograms constructed in analogous fashion to open time distributions in (E) above. The data were fit by the sum of three exponentials, by the method of maximum likelihood, with the following parameters: −prepulse (τ1 = 0.23 msec, 67%; τ2 = 1.98 msec, 23%;τ3 = 10.7 msec, 10%; 9916 events), +prepulse (τ1 = 0.25 msec, 68%;τ2 = 2.08 msec, 23%;τ3 = 12.9 msec, 9%; 10,221 events). All histograms, here and throughout, were averaged from three patches.
Fig. 3.
Fig. 3.
With depolarizations to +45 mV, G-protein-inhibited single N-type channels display slowly activating reluctant openings. A–F, Identical format as in Figure2. A, Mean unitary current amplitude was 0.62 ± 0.03 pA (n = 3). B, Ensemble average currents. Smooth gray traces overlaying ensemble average currents were produced by convolving the derivative of the FL with or without a prepulse (C), respectively, and thePoo obtained with a prepulse (Poo, +pre), as explained in Results.D,Poo distribution. Smooth curve through the data are reproduced from Figure2D. E, Open time histograms were fit by the sum of two exponentials with the following parameters: −prepulse (τ1 = 0.47 msec, 67%;τ2 = 1.75 msec, 33%; 7666 total events), and +prepulse (τ1 = 0.51 msec, 68%; τ2 = 1.74 msec, 32%; 13,252 events). F, Fits to closed time histograms had the following parameters; −prepulse (τ1 = 0.29 msec, 67%;τ2 = 2.68 msec, 29%;τ3 = 21.14 msec, 4%; 7494 events), +prepulse (τ1 = 0.28 msec, 69%;τ2 = 2.33 msec, 27%;τ3 = 14.18 msec, 4%; 13,078 events).G, Inhibited (no prepulse) traces were visually sorted into reluctant or willing groups based on whether they started out in a sparse or dense gating pattern. Lifetime distributions for first openings in the reluctant group were fit by a single exponential (τ = 0.22 msec.), whereas the same distribution for the willing group was well fit by the sum of two exponentials with the same parameters as in E (+prepulse), above.H,Poo distributions for visually sorted reluctant and willing sweeps. The steady-statePoo value of reluctant openings at this voltage was 0.02 (dotted line). Smooth linethrough willing Poo was reproduced from Figure 2D.
Fig. 4.
Fig. 4.
Reluctant N-channel openings occur with increased frequency and faster activation kinetics at +60 mV.A–H, Identical format as in Figure 3. A,Mean unitary current amplitude was 0.46 ± 0.01 pA (n = 3). B, Ensemble average currents. Identical format as in Figure 3B.C,FL distributions obtained either without (gray trace) or with (black trace) a prepulse. D, Smooth curve through the data are a least-squares fit of a biexponential function to the +prepulse data.E, Fits to open time histograms had the following parameters: −prepulse (τ1 = 0.41 msec, 72%; τ2 = 2.11 msec, 28%; 7722 total events), +prepulse (τ1 = 0.44 msec, 69%; τ2 = 2.23 msec, 31%; 10,365 total events). F, Fits to closed time histograms had the following parameters: −prepulse (τ1 = 0.23 msec, 73%;τ2 = 1.51 msec, 20%;τ3 = 15.9 msec, 7%; 7601 events), +prepulse (τ1 = 0.23 msec, 76%;τ2 = 1.64 msec, 19%;τ3 = 11.18 msec, 5%; 10,305 events).G, Lifetime distributions for first openings of reluctant sweeps were fit by a single exponential (τ = 0.23 msec), whereas those of willing channels were fit by two exponentials (τ1 = 0.58 msec, 61%;τ2 = 2.28 msec, 39%).H, The steady state reluctantPoo value was 0.07 (dotted line). Smooth curve through the willingPoo was reproduced from the fit inD.
Fig. 5.
Fig. 5.
G-protein-inhibited P/Q channels display a delayed latency to first opening, with no evidence of reluctant openings.A–F, Identical format as in Figure 3. A,Mean unitary current amplitude was 0.64 ± 0.04 pA (n = 3). D, Smooth curve through the data are a biexponential fit to Poogenerated from −prepulse traces under control conditions (−CCh).E, Parameters for fits to open time histograms were −prepulse (τ1 = 0.38 msec, 93%;τ2 = 1.05 msec, 7%; 16,078 total events), +prepulse (τ1 = 0.39 msec, 93%; τ2 = 1.12 msec, 7%; 17,503 total events). F, Closed time histogram fit parameters were: −prepulse (τ1 = 0.58 msec, 53%; τ2 = 2.77 msec, 45%;τ3 = 27.58 msec, 2%; 15,802 events); +prepulse (τ1 = 0.59 msec, 54%;τ2 = 2.87 msec, 44%;τ3 = 26.76 msec, 2%; 17,229 events).
Fig. 6.
Fig. 6.
Functional impact of reluctant openings on Ca2+ currents evoked by neuronal APWs.A, APWs of different half-width amplitudes (1.5, 2, and 2.5 msec) used to elicit Ca2+ currents.B, Exemplar N-type currents elicited by the indicated APWs either under control conditions (−CCh, black traces) or during G-protein inhibition (+CCh, dotted traces). G-protein-inhibited traces were scaled up (gray traces) to match their peaks with −CCh currents, to facilitate direct visual comparison of differences in time course. The difference in time for currents to reach 90% of maximal amplitude (Δt90) in the presence or absence of CCh was measured (arrows).Δt90 was significantly different in currents evoked by APWs of half-width 2 and 2.5 msec, respectively (*p < 0.05, paired two-tailedt test). C, Exemplar P/Q currents evoked under identical conditions as in B. Scaled-up +CCh traces (thick gray traces) precisely superimposed on the −CCh traces.

Similar articles

Cited by

References

    1. Aldrich RW, Corey DP, Stevens CF. A reinterpretation of mammalian sodium channel gating based on single channel recording. Nature. 1983;306:436–441. - PubMed
    1. Augustine GJ, Adler EM, Charlton MP. The calcium signal for transmitter secretion from presynaptic nerve terminals. Ann NY Acad Sci. 1991;635:365–381. - PubMed
    1. Bean BP. Neurotransmitter inhibition of neuronal calcium currents by changes in channel voltage dependence. Nature. 1989;340:153–156. - PubMed
    1. Bertram R, Sherman A, Stanley EF. Single-domain/bound calcium hypothesis of transmitter release and facilitation. J Neurophysiol. 1996;75:1919–1931. - PubMed
    1. Boland LM, Bean BP. Modulation of N-type calcium channels in bullfrog sympathetic neurons by luteinizing hormone-releasing hormone: kinetics and voltage dependence. J Neurosci. 1993;13:516–533. - PMC - PubMed

Publication types

MeSH terms

LinkOut - more resources