Long-range temporal correlations and scaling behavior in human brain oscillations
- PMID: 11160408
- PMCID: PMC6762238
- DOI: 10.1523/JNEUROSCI.21-04-01370.2001
Long-range temporal correlations and scaling behavior in human brain oscillations
Abstract
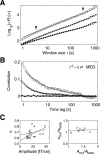
The human brain spontaneously generates neural oscillations with a large variability in frequency, amplitude, duration, and recurrence. Little, however, is known about the long-term spatiotemporal structure of the complex patterns of ongoing activity. A central unresolved issue is whether fluctuations in oscillatory activity reflect a memory of the dynamics of the system for more than a few seconds. We investigated the temporal correlations of network oscillations in the normal human brain at time scales ranging from a few seconds to several minutes. Ongoing activity during eyes-open and eyes-closed conditions was recorded with simultaneous magnetoencephalography and electroencephalography. Here we show that amplitude fluctuations of 10 and 20 Hz oscillations are correlated over thousands of oscillation cycles. Our analyses also indicated that these amplitude fluctuations obey power-law scaling behavior. The scaling exponents were highly invariant across subjects. We propose that the large variability, the long-range correlations, and the power-law scaling behavior of spontaneous oscillations find a unifying explanation within the theory of self-organized criticality, which offers a general mechanism for the emergence of correlations and complex dynamics in stochastic multiunit systems. The demonstrated scaling laws pose novel quantitative constraints on computational models of network oscillations. We argue that critical-state dynamics of spontaneous oscillations may lend neural networks capable of quick reorganization during processing demands.
Figures


Similar articles
-
Stimulus-induced change in long-range temporal correlations and scaling behaviour of sensorimotor oscillations.Eur J Neurosci. 2004 Jan;19(1):203-11. doi: 10.1111/j.1460-9568.2004.03116.x. Eur J Neurosci. 2004. PMID: 14750978
-
Long-range temporal correlations in electroencephalographic oscillations: Relation to topography, frequency band, age and gender.Neuroscience. 2005;130(2):549-58. doi: 10.1016/j.neuroscience.2004.10.007. Neuroscience. 2005. PMID: 15664711
-
Human EEG shows long-range temporal correlations of oscillation amplitude in Theta, Alpha and Beta bands across a wide age range.Clin Neurophysiol. 2010 Aug;121(8):1187-97. doi: 10.1016/j.clinph.2010.02.163. Epub 2010 Mar 25. Clin Neurophysiol. 2010. PMID: 20346732
-
Random graph theory and neuropercolation for modeling brain oscillations at criticality.Curr Opin Neurobiol. 2015 Apr;31:181-8. doi: 10.1016/j.conb.2014.11.005. Epub 2014 Dec 1. Curr Opin Neurobiol. 2015. PMID: 25460075 Review.
-
Roles of Brain Criticality and Multiscale Oscillations in Temporal Predictions for Sensorimotor Processing.Trends Neurosci. 2018 Oct;41(10):729-743. doi: 10.1016/j.tins.2018.08.008. Epub 2018 Sep 25. Trends Neurosci. 2018. PMID: 30274607 Review.
Cited by
-
Long-range temporal correlations in resting-state α oscillations predict human timing-error dynamics.J Neurosci. 2013 Jul 3;33(27):11212-20. doi: 10.1523/JNEUROSCI.2816-12.2013. J Neurosci. 2013. PMID: 23825424 Free PMC article.
-
Scale-Free and Multifractal Time Dynamics of fMRI Signals during Rest and Task.Front Physiol. 2012 Jun 15;3:186. doi: 10.3389/fphys.2012.00186. eCollection 2012. Front Physiol. 2012. PMID: 22715328 Free PMC article.
-
Why should cognitive neuroscientists study the brain's resting state?Front Hum Neurosci. 2013 Feb 20;7:45. doi: 10.3389/fnhum.2013.00045. eCollection 2013. Front Hum Neurosci. 2013. PMID: 23431277 Free PMC article. No abstract available.
-
A new perspective on the functioning of the brain and the mechanisms behind conscious processes.Front Psychol. 2013 Apr 30;4:242. doi: 10.3389/fpsyg.2013.00242. eCollection 2013. Front Psychol. 2013. PMID: 23641229 Free PMC article.
-
Combined nonlinear metrics to evaluate spontaneous EEG recordings from chronic spinal cord injury in a rat model: a pilot study.Cogn Neurodyn. 2016 Oct;10(5):367-73. doi: 10.1007/s11571-016-9394-0. Epub 2016 Jul 1. Cogn Neurodyn. 2016. PMID: 27668016 Free PMC article.
References
-
- Alstrøm P, Stassinopoulos D. Versatility and adaptive performance. Phys Rev E Stat Phys Plasmas Fluids Relat Interdiscip Topics. 1995;51:5027–5032. - PubMed
-
- Arieli A, Sterkin A, Grinvald A, Aertsen A. Dynamics of ongoing activity: explanation of the large variability in evoked cortical responses. Science. 1996;273:1868–1871. - PubMed
-
- Bak P. How nature works. Oxford UP; Oxford: 1997.
-
- Bak P, Tang C, Wiesenfeld K. Self-organized criticality: an explanation of 1/f noise. Phys Rev Lett. 1987;59:381–384. - PubMed
-
- Bak P, Tang C, Wiesenfeld K. Self-organized criticality. Phys Rev A. 1988;38:364–374. - PubMed
Publication types
MeSH terms
LinkOut - more resources
Full Text Sources
Other Literature Sources
