. 2001 Jan 15;21(2):713-25.
doi: 10.1523/JNEUROSCI.21-02-00713.2001.

Reliability of macaque frontal eye field neurons signaling saccade targets during visual search

Affiliations

Reliability of macaque frontal eye field neurons signaling saccade targets during visual search

N P Bichot et al. J Neurosci. .

Abstract

Although many studies have explored the neural correlates of visual attention and selection, few have examined the reliability with which neurons represent relevant information. We monitored activity in the frontal eye field (FEF) of monkeys trained to make a saccade to a target defined by the conjunction of color and shape or to a target defined by color differences. The difficulty of conjunction search was manipulated by varying the number of distractors, and the difficulty of feature search was manipulated by varying the similarity in color between target and distractors. The reliability of individual neurons in signaling the target location in correct trials was determined using a neuron-anti-neuron approach within a winner-take-all architecture. On average, approximately seven trials of the activity of single neurons were sufficient to match near-perfect behavioral performance in the easiest search, and approximately 14 trials were sufficient in the most difficult search. We also determined how many neurons recorded separately need to be evaluated within a trial to match behavioral performance. Results were quantitatively similar to those of the single neuron analysis. We also found that signal reliability in the FEF did not change with task demands, and overall, behavioral accuracy across the search tasks was approximated when only six trials or neurons were combined. Furthermore, whether combining trials or neurons, the increase in time of target discrimination corresponded to the increase in mean saccade latency across visual search difficulty levels. Finally, the variance of spike counts in the FEF increased as a function of the mean spike count, and the parameters of this relationship did not change with attentional selection.


Figures

Fig. 1.
Fig. 1.
Behavioral tasks. The monkey's task was to shift gaze to a target stimulus during conjunction search with four (A) or six (B) stimuli, or a feature search with the target easy (C) or difficult (D) to discriminate from distractors. The discrimination in the difficult feature search was more difficult than depicted schematically in D.Dotted circles represent the monkey's current point of fixation; the arrow represents the saccade to the target. Stimuli are not drawn to scale.
Fig. 2.
Fig. 2.
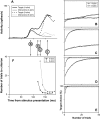
Reliability of target selection by an FEF neuron during conjunction search. A, Spike density function of the neuron when the target (thick lines) or distractors (thin lines) of the search array fell in its receptive field during conjunction search with four (solid lines) or six (dashed lines) stimuli. Spike density functions were aligned on stimulus presentation at time 0 and are plotted up to the mean saccade latency during each search condition. Only spikes that occurred before saccade initiation were used in the calculations.B–E, Probability of target choice as a function of number of trials combined by the simulation at the four different time points shown between A and B.Filled circles represent simulations for search with four stimuli, and open circles represent simulations for search with six stimuli. The number of trials needed to reach a fixed criterion level (i.e., 95% indicated by dotted line) was determined by fitting exponential functions to the data points.F, The number of trials required to reach the criterion level is shown as a function of time from stimulus presentation for search with four (●) and six (○) stimuli. The best-fit exponential curves are shown overlaid on the data points. The absence of data points signifies that the number of combined trials needed to result in a target choice probability that matched the criterion level was indeterminate (e.g., both curves in B and the curve for search with six stimuli in C).
Fig. 3.
Fig. 3.
Summary of neuron-by neuron analysis during conjunction search. A, Distribution of the number of trials needed to reach the near-perfect performance criterion (95% target choice) when the quality of neural selection reached an asymptote. B, Distribution of the time at which neurons began to discriminate the target from distractors at the near-perfect criterion level. In both plots, gray bars represent data from conjunction search with four stimuli, and black bars represent data from conjunction search with six stimuli. The arrowheads under the abscissa mark the average of each distribution.
Fig. 4.
Fig. 4.
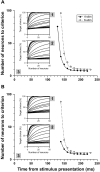
Population analysis of selection reliability in the FEF during conjunction search. A3, The number of neurons required to reach the near-perfect performance criterion (95% target choice) is plotted as a function of time from stimulus presentation during search with four stimuli (●) and search with six stimuli (○). These values were derived from the curves of target choice probability as a function of the number of neurons the activity of which was combined by the simulation shown in the top inset for search with four stimuli (A1) and in the bottom inset for search with six stimuli (A2). These insets plot target choice probability as a function of the number of neurons contributing activity. The plots for successive times are superimposed, and these families of curves show the progression of selection reliability as in Figure 2B-E. In these simulations, neurons were selected with redundancy, entirely randomly on each iteration, resulting in the possibility that a given neuron was selected more than once (see Materials and Methods). B, Same asA except that neurons were chosen without redundancy and pseudorandomly on each iteration so that each neuron was not selected more than once.
Fig. 5.
Fig. 5.
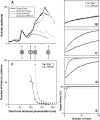
Reliability of target selection by an FEF neuron during feature search. A, Spike density function of the neuron when the target (thick lines) or distractors (thin lines) of the search array fell in its receptive field during easy (solid lines) or difficult (dashed lines) feature search.BF, Reliability calculations during easy search are represented by ●, and calculations during difficult search are represented by ○. All other conventions are as in Figure3.
Fig. 6.
Fig. 6.
Summary of neuron-by neuron analysis during feature search. Gray bars represent data from the easy feature search, and black bars represent data from the difficult feature search. All other conventions are as in Figure4.
Fig. 7.
Fig. 7.
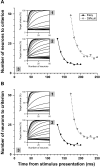
Population analysis of selection reliability in the FEF during feature search. A3, The number of neurons required to reach the near-perfect performance criterion (95% target choice) is plotted as a function of time from stimulus presentation during easy search (●) and difficult search (○). These values were derived from the curves of target choice probability as a function of the number of neurons the activity of which was combined by the simulation shown in the top inset for easy search (A1) and in the bottom inset for difficult search (A2). In these simulations, neurons were selected entirely randomly on each iteration, resulting in the possibility that a given neuron was selected more than once (see Materials and Methods). B, Same as Aexcept that neurons were chosen pseudorandomly on each iteration so that each neuron was not selected more than once.
Fig. 8.
Fig. 8.
Summary of neural reliability and time course of target discrimination across visual search difficulty levels.A, The number of trials (■) and the number of neurons (▵) that needed to be combined to reach the near-perfect performance criterion (95% target choice) when neural selection reached a steady state is plotted against response error rates during each visual search task (i.e., conjunction search and feature search) and each level of difficulty within that task. B, The times of target discrimination derived from the neuron-by-neuron analysis (■) and from the population analysis (▵) are plotted against mean saccade latencies during each visual search task and level of difficulty within that task. The equation of the principal axis of the regression ellipse is shown in each plot. The results of the population analysis with and without redundancy were combined.
Fig. 9.
Fig. 9.
This plot shows the number of trials (■) and neurons (▵) that needed to be combined to match the actual percentage of correctly performed trials in each task across levels of difficulty. The dotted line indicates the average across these points.
Fig. 10.
Fig. 10.
Population response variance functions.A, Relationship between spike variance and spike counts when the target (●) or a distractor (xsymbols) was in the receptive field of a neuron during a time interval before target selection (0–100 msec after stimulus presentation). B, Same as A during a time interval in which neurons discriminated target from distractors (100–0 msec before saccade initiation). Data from conjunction search and feature search, as well as the levels of difficulty within each task, are shown combined. The equation of the best-fit power function is shown for each plot.

References

    1. Bichot NP. Attention, eye movements, and neurons: linking physiology and behavior. In: Harris LR, Jenkin MRM, editors. Vision and attention. Springer-Verlag; New York: 2001.
    1. Bichot NP, Schall JD. Saccade target selection in macaque during feature and conjunction visual search. Vis Neurosci. 1999a;16:81–89. - PubMed
    1. Bichot NP, Schall JD. Effects of similarity and history on neural mechanisms of visual selection. Nat Neurosci. 1999b;2:549–554. - PubMed
    1. Bichot NP, Schall JD, Thompson KG. Visual feature selectivity in frontal eye fields induced by experience in mature macaques. Nature. 1996;381:697–699. - PubMed
    1. Britten KH, Shadlen MN, Newsome WT, Movshon JA. Responses of neurons in macaque MT to stochastic motion signals. Vis Neurosci. 1993;10:1157–1169. - PubMed

Publication types

LinkOut - more resources