. 2001 Feb;75(4):1708-21.
doi: 10.1128/JVI.75.4.1708-1721.2001.

Specific interaction of hepatitis C virus protease/helicase NS3 with the 3'-terminal sequences of viral positive- and negative-strand RNA

Affiliations

Specific interaction of hepatitis C virus protease/helicase NS3 with the 3'-terminal sequences of viral positive- and negative-strand RNA

R Banerjee et al. J Virol. 2001 Feb.

Abstract

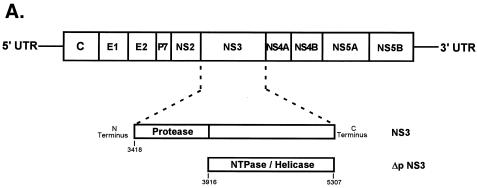
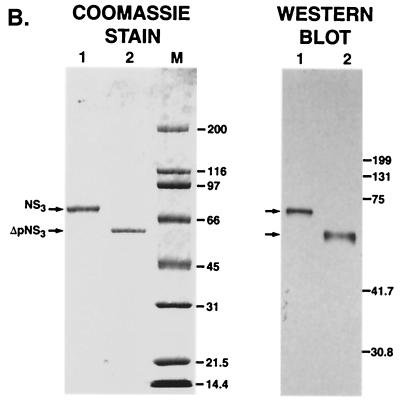
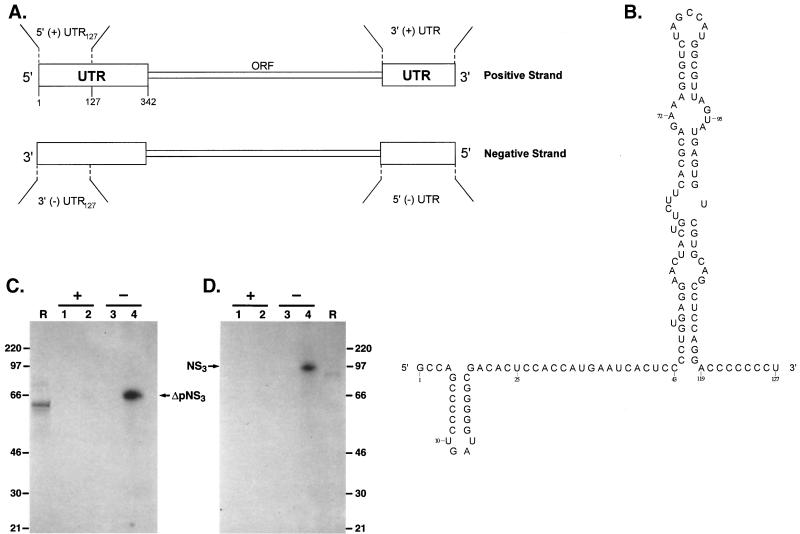
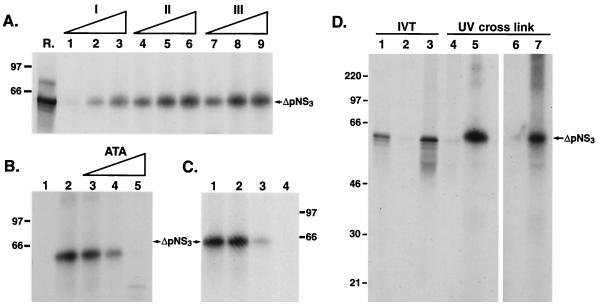
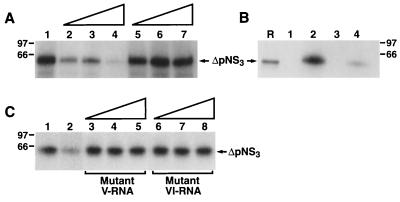
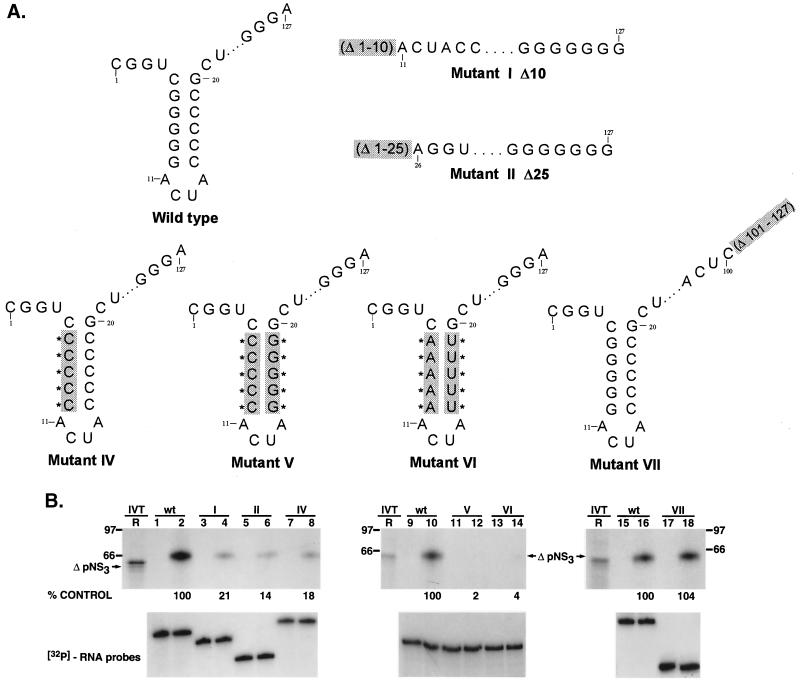
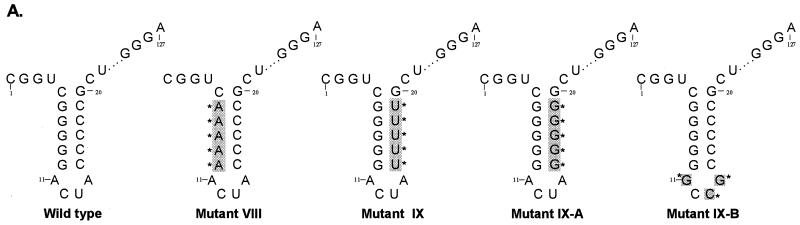
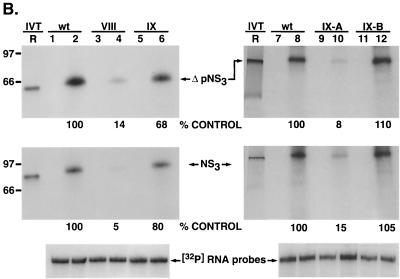
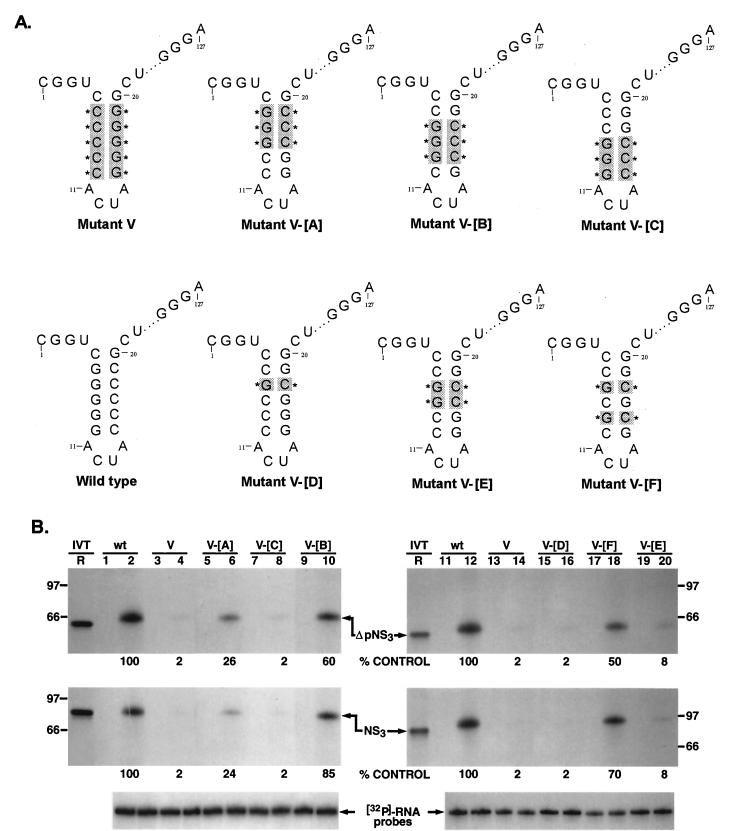
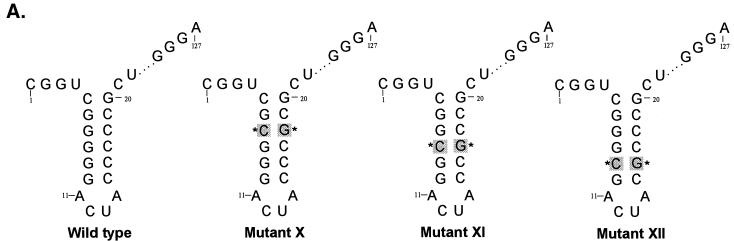
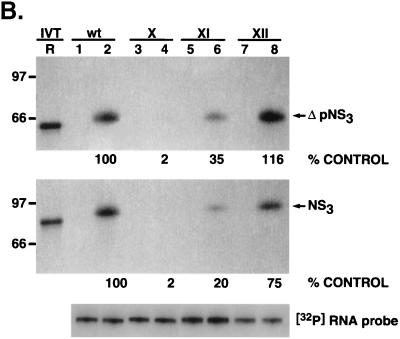
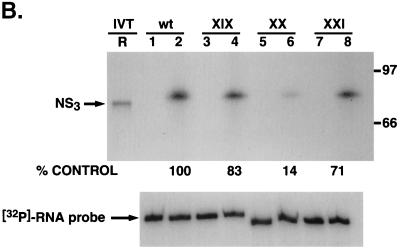
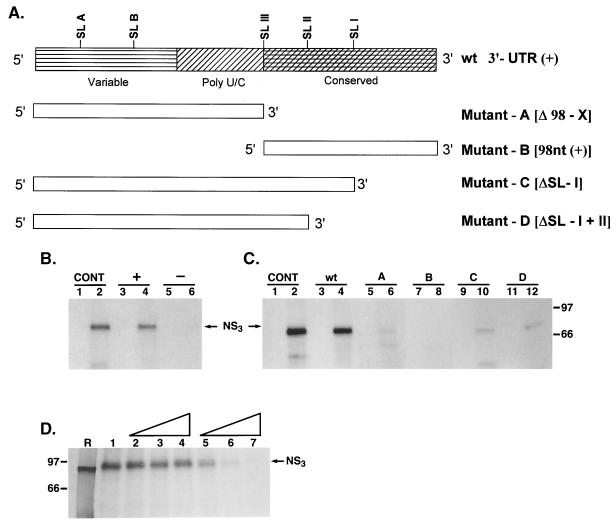
The hepatitis C virus (HCV)-encoded protease/helicase NS3 is likely to be involved in viral RNA replication. We have expressed and purified recombinant NS3 (protease and helicase domains) and Delta pNS3 (helicase domain only) and examined their abilities to interact with the 3'-terminal sequence of both positive and negative strands of HCV RNA. These regions of RNA were chosen because initiation of RNA synthesis is likely to occur at or near the 3' untranslated region (UTR). The results presented here demonstrate that NS3 (and Delta pNS3) interacts efficiently and specifically with the 3'-terminal sequences of both positive- and negative-strand RNA but not with the corresponding complementary 5'-terminal RNA sequences. The interaction of NS3 with the 3'-terminal negative strand [called 3'(-) UTR(127)] was specific in that only homologous (and not heterologous) RNA competed efficiently in the binding reaction. A predicted stem-loop structure present at the 3' terminus (nucleotides 5 to 20 from the 3' end) of the negative-strand RNA appears to be important for NS3 binding to the negative-strand UTR. Deletion of the stem-loop structure almost totally impaired NS3 (and Delta pNS3) binding. Additional mutagenesis showed that three G-C pairs within the stem were critical for helicase-RNA interaction. The data presented here also suggested that both a double-stranded structure and the 3'-proximal guanosine residues in the stem were important determinants of protein binding. In contrast to the relatively stringent requirement for 3'(-) UTR binding, specific interaction of NS3 (or Delta pNS3) with the 3'-terminal sequences of the positive-strand RNA [3'(+) UTR] appears to require the entire 3'(+) UTR of HCV. Deletion of either the 98-nucleotide 3'-terminal conserved region or the 5' half sequence containing the variable region and the poly(U) and/or poly(UC) stretch significantly impaired RNA-protein interaction. The implication of NS3 binding to the 3'-terminal sequences of viral positive- and negative-strand RNA in viral replication is discussed.


Figures

FIG. 1
FIG. 1
HCV-encoded NS3 protein expression. (A) Schematic representation of HCV genome organization marking the relative position of NS3 protein. The numbers correspond to nucleotide positions in the HCV 1969 cDNA clone. (B) On the left is a Coomassie blue-stained gel of purified NS3 and ΔpNS3. The positions of the NS3 (lane 1) and ΔpNS3 (lane 2) proteins are indicated, along with the protein marker lane (M). On the right is a Western blot analysis of the purified proteins resolved on a 14% gel; lanes 1 and 2 correspond to the same protein samples run on the Coomassie blue-stained gel. The numbers on the right correspond to the migrations of the molecular mass marker proteins and are marked in kDa.
FIG. 1
FIG. 1
HCV-encoded NS3 protein expression. (A) Schematic representation of HCV genome organization marking the relative position of NS3 protein. The numbers correspond to nucleotide positions in the HCV 1969 cDNA clone. (B) On the left is a Coomassie blue-stained gel of purified NS3 and ΔpNS3. The positions of the NS3 (lane 1) and ΔpNS3 (lane 2) proteins are indicated, along with the protein marker lane (M). On the right is a Western blot analysis of the purified proteins resolved on a 14% gel; lanes 1 and 2 correspond to the same protein samples run on the Coomassie blue-stained gel. The numbers on the right correspond to the migrations of the molecular mass marker proteins and are marked in kDa.
FIG. 2
FIG. 2
HCV-encoded NS3-RNA interaction. (A) Schematic representation of the viral positive-strand UTR used in the present study. (B) Predicted secondary structure of the first 127 nucleotides of the sequence of the positive strand, 5′(+) UTR127 (adapted from reference 20). (C and D) Analysis of purified ΔpNS3 and NS3 binding to the 5′ positive- or 3′ negative-strand UTR127 RNA probe. The binding reaction mixture contained either 5′(+) UTR127 (lanes 1 and 2) or 3′(−) UTR127 (lanes 3 and 4) probe. Lanes 1 and 3 are controls with no protein added while in lanes 2 and 4 approximately 100 ng of ΔpNS3 (C) or NS3 (D) was added. The migration of the [35S]methionine-labeled in vitro-translated wild-type or truncated NS3 is shown in lanes R, and the numbers correspond to the migrations of rainbow molecular mass markers (Amersham) in kDa. The relative position of the UV-cross-linked RNA-protein complex is indicated.
FIG. 3
FIG. 3
Characterization of the interaction between ΔpNS3 and 3′ UTR127 RNA. (A) Effect of binding buffer composition on nucleoprotein complex formation. Reaction mixtures containing ΔpNS3 were incubated with RNA probes under various binding buffers as detailed in Materials and Methods. The protein was analyzed for each binding buffer condition at three concentrations (approximately 50, 100, and 150 ng/25-μl reaction volume), and UV-cross-linked complexes were resolved by SDS–14% PAGE. Lane R represents in vitro-translated [35S]methionine-labeled ΔpNS3 protein, and the numbers on the left indicate the positions of the molecular mass marker proteins in kDa. (B) Effect of nucleoprotein inhibitor ATA on complex formation. Reactions with (lane 2) or without (lane 1) ΔpNS3 and reactions in the presence of increasing concentrations (2.5, 5.0, and 10 μM) of ATA and ΔpNS3 (lanes 3 to 5) are shown. (C) Effect of heat denaturation of ΔpNS3 on RNA interaction. The ΔpNS3 protein was preincubated for 10 min at 30, 40, 65, and 90°C (lanes 1 to 4) prior to its addition to the binding reaction and then was processed as described above. (D) Immunoprecipitation analysis of the UV-cross-linked RNA-protein complex. Purified ΔpNS3 UV cross-linked to 3′(−) UTR127 was immunoprecipitated as detailed in Materials and Methods. [35S]methionine-labeled in vitro-translated (IVT) ΔpNS3 protein was analyzed directly (lane 1) or following immunoprecipitation with anti-NS3 (lane 3) or a nonspecific antibody (lane 2). Lanes 4 to 7 contain UV-cross-linked RNA-protein complex either loaded directly (lanes 4 and 5) or following immunoprecipitation with the control (lane 6) or anti-NS3 (lane 7) antibody. The reaction mixtures in lanes 5 to 7 contained ΔpNS3, but lane 4 had no added ΔpNS3. The portion of the gel containing lanes 6 and 7 was overexposed to visualize the ΔpNS3 band.
FIG. 4
FIG. 4
Specificity of ΔpNS3 binding to the negative-strand RNA probe. (A) Cold homologous RNA corresponding to the 3′-terminal 127 bases of the negative strand and a heterologous, similar-size RNA sequence from hepatitis A virus were used in the competition assay as described in Materials and Methods. Reactions were performed without (lane 1) or with 50 (lane 2), 100 (lane 3), or 250 (lane 4) ng of cold homologous RNA or 50 (lane 5), 100 (lane 6), or 250 (lane 7) ng of heterologous RNA. (B) Specific binding to negative-strand RNA. A similar-size RNA obtained from the coding sequence of the HCV negative strand, labeled and processed as described for the UTR127 probe, was added to the binding reaction containing the ΔpNS3 protein. Lane R represents the [35S]methionine-labeled in vitro-translated ΔpNS3 protein. Protein binding to 3′(−) UTR127 probe without (lane 1) and with (lane 2) added ΔpNS3 is shown. Lanes 3 and 4 shows binding to RNA derived from the coding sequence in the absence (lane 3) and presence (lane 4) of ΔpNS3. (C) Competition using inactive mutant V and VI UTR127RNAs. The cold mutant RNAs were added to binding reactions as for panel A. Reactions with no cold competing RNA (control) (lane 1), with homologous RNA (lane 2), and with increasing concentrations (50, 100, and 250 ng/25-μl reaction volume) of mutant V or VI RNA (lanes 3 to 8) are shown. Homologous RNA was used at the same concentration as for lane 3 in panel A.
FIG. 5
FIG. 5
Analysis of HCV-encoded ΔpNS3 interaction with negative-strand 3′ UTR127 mutant RNA probes. (A) Schematic illustration of the mutant RNAs used in the binding assay. Mutants with deleted (mutants I, II, and VII) or altered (mutants IV, V, and VI) bases compared to the wild-type RNA are indicated by shading and Δ or ∗, respectively. The intervening sequences are indicated by dots. (B) UV-cross-linking analysis of ΔpNS3 protein binding to mutant RNAs. Lanes 1, 2, 9, 10, 15, and 16 represent binding to wild-type (wt) RNA and the remaining lanes show binding to the mutant RNAs as indicated above each set of lanes. The odd-numbered lanes served as control reactions with no added protein, while the even-numbered lanes represent binding reactions containing approximately 100 ng of purified ΔpNS3. Lane R is the [35S]methionine-labeled in vitro-translated ΔpNS3, and the numbers on the left and right indicate the positions of the rainbow molecular mass marker proteins in kDa. The lower gels show the stability of the RNA probes in the absence and presence of ΔpNS3 protein, the details of which are discussed in Materials and Methods. The relative binding of ΔpNS3 protein to mutant RNAs compared to the control wild-type RNA is shown as percent control.
FIG. 6
FIG. 6
Analysis of NS3 and ΔpNS3 binding to the 3′ negative-strand UTR127 mutant RNAs. (A) Schematic illustration of the mutant RNAs used in binding analysis. The altered bases in the mutant RNAs compared to the wild-type RNA are shaded and marked by asterisks. The intervening sequences are indicated by dots. (B) Specific RNA binding activity of NS3 and ΔpNS3 proteins using the mutant RNA probes. Reactions showing binding to either wild-type (wt) or mutant (mutant VIII, IX, IX-A, and IX-B) RNA probes are indicated above the gel. The odd-numbered lanes contain control reactions with no added proteins, while the even-numbered lanes represent binding reactions containing either the ΔpNS3 or NS3 protein. Lanes R represent [35S]methionine-labeled in vitro-translated (IVT) ΔpNS3 or NS3, respectively, and the numbers on the left indicate the positions of the molecular mass marker proteins in kDa. Only the relevant IVT proteins are shown along with the appropriate binding reactions. The bottom gel shows the result of probe stability analysis with NS3 protein, the details of which are discussed in Materials and Methods. Quantitation of RNA-protein complexes is indicated as percent control.
FIG. 6
FIG. 6
Analysis of NS3 and ΔpNS3 binding to the 3′ negative-strand UTR127 mutant RNAs. (A) Schematic illustration of the mutant RNAs used in binding analysis. The altered bases in the mutant RNAs compared to the wild-type RNA are shaded and marked by asterisks. The intervening sequences are indicated by dots. (B) Specific RNA binding activity of NS3 and ΔpNS3 proteins using the mutant RNA probes. Reactions showing binding to either wild-type (wt) or mutant (mutant VIII, IX, IX-A, and IX-B) RNA probes are indicated above the gel. The odd-numbered lanes contain control reactions with no added proteins, while the even-numbered lanes represent binding reactions containing either the ΔpNS3 or NS3 protein. Lanes R represent [35S]methionine-labeled in vitro-translated (IVT) ΔpNS3 or NS3, respectively, and the numbers on the left indicate the positions of the molecular mass marker proteins in kDa. Only the relevant IVT proteins are shown along with the appropriate binding reactions. The bottom gel shows the result of probe stability analysis with NS3 protein, the details of which are discussed in Materials and Methods. Quantitation of RNA-protein complexes is indicated as percent control.
FIG. 7
FIG. 7
Rescue analysis of NS3 and ΔpNS3 binding to mutant V RNA. (A) Schematic illustration of the various mutant probes used for RNA-protein binding analysis. All of the probes contain mutant V RNA as a backbone. The reversion to the wild-type sequence of specific C-G→G-C base pairs in the 3′-proximal stem is marked by shading and an asterisk. The intervening sequences are indicated by dots. (B) Restoration of specific nucleoprotein complex between mutant RNA probes V-[A] to-[E] and NS3 (full length and truncated). Reactions containing either wild-type (wt) or mutant RNA are indicated above the gels. The odd-numbered lanes served as controls without the added proteins, while the even-numbered lanes represent binding reactions containing approximately 100 ng of either purified ΔpNS3 or NS3 protein. Lane R represents the [35S]methionine-labeled in vitro-translated (IVT) ΔpNS3 (top) or NS3 (middle) protein, and the numbers on the left and right indicate the positions of migration of the molecular mass marker proteins in kDa. Only the relevant IVT proteins are shown along with the appropriate binding reactions. The bottom gel shows the results of probe stability analysis with the NS3 protein, the details of which are discussed in Materials and Methods. Quantitation of the RNA-protein complex is indicated as percent control for both NS3 and ΔpNS3 binding.
FIG. 8
FIG. 8
Analysis of NS3 and ΔpNS3 protein binding to 3′ negative-strand UTR127 RNA mutants with a single G-C→C-G change. (A) Schematic illustration of the mutant RNA probes used in binding analysis. The base pair sequences in the mutant RNAs that are altered compared to the wild-type sequence are marked by shading and asterisks. The intervening sequences are indicated by dots. (B) Specific RNA binding activity of NS3 and ΔpNS3 proteins to mutant RNA probes. Reaction lanes showing binding to either wild-type (wt) or mutant (X, XI, and XII) RNA probes are indicated above the gels. The odd-numbered lanes contain control reactions with no added proteins, while the even-numbered lanes represent binding reactions containing approximately 100 ng of either purified ΔpNS3 or NS3 protein. Lane R represents the [35S]methionine-labeled in vitro-translated (IVT) ΔpNS3 or NS3 protein, and the numbers on the left indicate the positions of migration of the molecular mass marker proteins in kDa. Only the relevant IVT proteins are shown along with the appropriate binding reactions. The bottom gel shows the result of probe stability analysis with NS3 protein, the details of which are discussed in Materials and Methods. Quantitation of the RNA-protein complex is indicated as percent control for both NS3 and ΔpNS3 binding.
FIG. 8
FIG. 8
Analysis of NS3 and ΔpNS3 protein binding to 3′ negative-strand UTR127 RNA mutants with a single G-C→C-G change. (A) Schematic illustration of the mutant RNA probes used in binding analysis. The base pair sequences in the mutant RNAs that are altered compared to the wild-type sequence are marked by shading and asterisks. The intervening sequences are indicated by dots. (B) Specific RNA binding activity of NS3 and ΔpNS3 proteins to mutant RNA probes. Reaction lanes showing binding to either wild-type (wt) or mutant (X, XI, and XII) RNA probes are indicated above the gels. The odd-numbered lanes contain control reactions with no added proteins, while the even-numbered lanes represent binding reactions containing approximately 100 ng of either purified ΔpNS3 or NS3 protein. Lane R represents the [35S]methionine-labeled in vitro-translated (IVT) ΔpNS3 or NS3 protein, and the numbers on the left indicate the positions of migration of the molecular mass marker proteins in kDa. Only the relevant IVT proteins are shown along with the appropriate binding reactions. The bottom gel shows the result of probe stability analysis with NS3 protein, the details of which are discussed in Materials and Methods. Quantitation of the RNA-protein complex is indicated as percent control for both NS3 and ΔpNS3 binding.
FIG. 9
FIG. 9
Analysis of NS3 binding to additional 3′UTR127 RNA mutants with specific G-C→A-U changes. (A) Schematic illustration of the mutant RNA probes used in the binding analysis. The base pair sequence in the mutant RNAs that have been altered compared to the wild-type sequence are marked by shading and asterisks. The intervening sequences are indicated by dots. (B) Specific RNA binding activity of NS3 protein to mutant RNA probes. Reaction lanes with binding to either wild-type (wt) or mutant (XIX, XX, and XXI) RNA probes are indicated above the gels. The odd-numbered lanes contain control reactions with no added protein while the even-numbered lanes represent binding reactions containing 100 ng of purified NS3 protein. Lane R represents the [35S]methionine-labeled in vitro-translated NS3 protein, and the numbers on the right indicate the migrations of the molecular mass marker proteins in kDa. The lower gel represents the result of probe stability analysis with and without NS3 protein in the binding reaction, as in the experiments discussed above. The relative binding of NS3 protein to mutant RNAs compared to the wild-type RNA is shown as percent control.
FIG. 9
FIG. 9
Analysis of NS3 binding to additional 3′UTR127 RNA mutants with specific G-C→A-U changes. (A) Schematic illustration of the mutant RNA probes used in the binding analysis. The base pair sequence in the mutant RNAs that have been altered compared to the wild-type sequence are marked by shading and asterisks. The intervening sequences are indicated by dots. (B) Specific RNA binding activity of NS3 protein to mutant RNA probes. Reaction lanes with binding to either wild-type (wt) or mutant (XIX, XX, and XXI) RNA probes are indicated above the gels. The odd-numbered lanes contain control reactions with no added protein while the even-numbered lanes represent binding reactions containing 100 ng of purified NS3 protein. Lane R represents the [35S]methionine-labeled in vitro-translated NS3 protein, and the numbers on the right indicate the migrations of the molecular mass marker proteins in kDa. The lower gel represents the result of probe stability analysis with and without NS3 protein in the binding reaction, as in the experiments discussed above. The relative binding of NS3 protein to mutant RNAs compared to the wild-type RNA is shown as percent control.
FIG. 10
FIG. 10
Analysis of NS3 binding to the 3′ UTR of the positive strand. (A) Schematic representation of the viral 3′ UTR RNA and the derived mutants used in analysis. The mutants with deleted RNA sequences (mutants A to D) are shown. (B) UV-cross-linking analysis of NS3 binding to 3′ UTR RNA of the positive strand (lanes 3 and 4) and the corresponding complementary region of the negative-strand 5′ UTR probe (lanes 5 and 6). The specific interaction of NS3 with the negative-strand 3′ UTR127 probe was included as a control (CONT) (lanes 1 and 2) (see Materials and Methods). (C) Binding analysis using mutant RNA probes (A, B, C, and D). NS3 binding to the mutant RNA probes (lanes 5 to 12) is compared to its binding to the wild-type 3′(+) UTR probe (lanes 1 and 2). Reactions with mutant RNA probes are indicated above the gel. The reactions in lanes 1 and 2 are similar to those in panel B. The odd-numbered lanes in each set contain control reactions with no added protein, while the even-numbered lanes represent binding reactions containing approximately 100 ng of purified NS3 protein. The positions of UV-cross-linked complexes are indicated. (D) Specificity of NS3 interaction with 3′ UTR probe RNA. Cold homologous RNA corresponding to the 3′ UTR and a heterologous viral RNA with poly(U) sequence were added to reactions as detailed in Materials and Methods. Reaction mixtures contained no competitor RNA (control reaction [lane 1]); 50 (lane 2), 250 (lane 3), or 500 (lane 4) ng of cold heterologous RNA; or similar amounts of homologous RNA (lanes 5 to 7). Lane R is the [35S]methionine-labeled in vitro-translated NS3 protein. The positions of the proteins are marked.

References

    1. Banerjee R, Igo M, Izumi R, Datta U, Dasgupta A. In vitro replication of RNA viruses. In: Cann A J, editor. RNA viruses. Oxford, United Kingdom: Oxford University Press; 2000. pp. 141–178.
    1. Banerjee R, Echeverri A, Dasgupta A. Polio virus-encoded 2C polypeptide specifically binds to the 3′-terminal sequences of viral negative-strand RNA. J Virol. 1997;71:9570–9578. - PMC - PubMed
    1. Bartenschlager R, Ahlborn-Laake L, Yasargil K, Mous J, Jacobsen H. Kinetic and structural analyses of hepatitis C virus polyprotein processing. J Virol. 1994;68:5045–5055. - PMC - PubMed
    1. Bartenschlager R L, Lohmann V, Wilkinson T, Koch J O. Complex formation between the NS3 serine-type proteinase of the hepatitis C virus and NS4A and its importance for polyprotein maturation. J Virol. 1995;69:7519–7528. - PMC - PubMed
    1. Bienz K, Egger D, Troxler M, Pasamontes L. Structural organization of poliovirus RNA replication is mediated by viral proteins of the P2 genomic regions. J Virol. 1990;64:1156–1163. - PMC - PubMed

Publication types

MeSH terms

LinkOut - more resources