. 2001 Feb 1;29(3):668-76.
doi: 10.1093/nar/29.3.668.

Antisense-mediated decrease in DNA ligase III expression results in reduced mitochondrial DNA integrity

Affiliations

Antisense-mediated decrease in DNA ligase III expression results in reduced mitochondrial DNA integrity

U Lakshmipathy et al. Nucleic Acids Res. .

Abstract

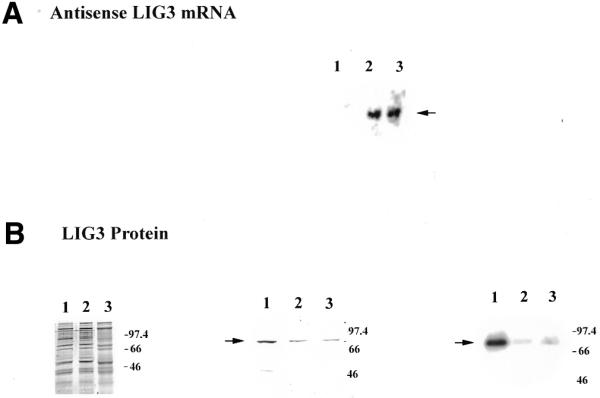
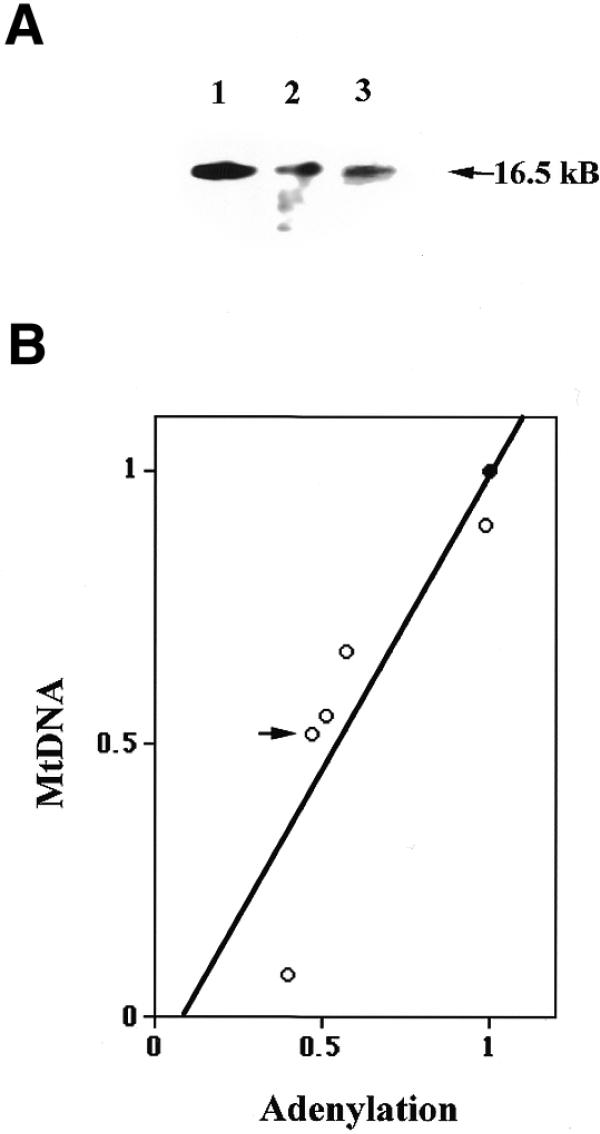
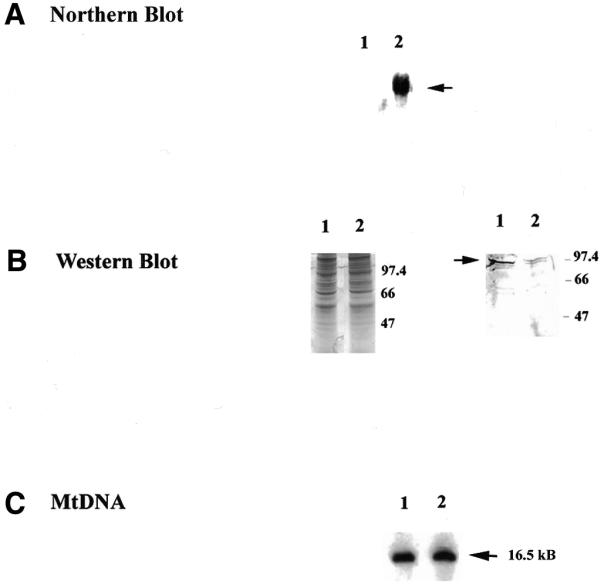
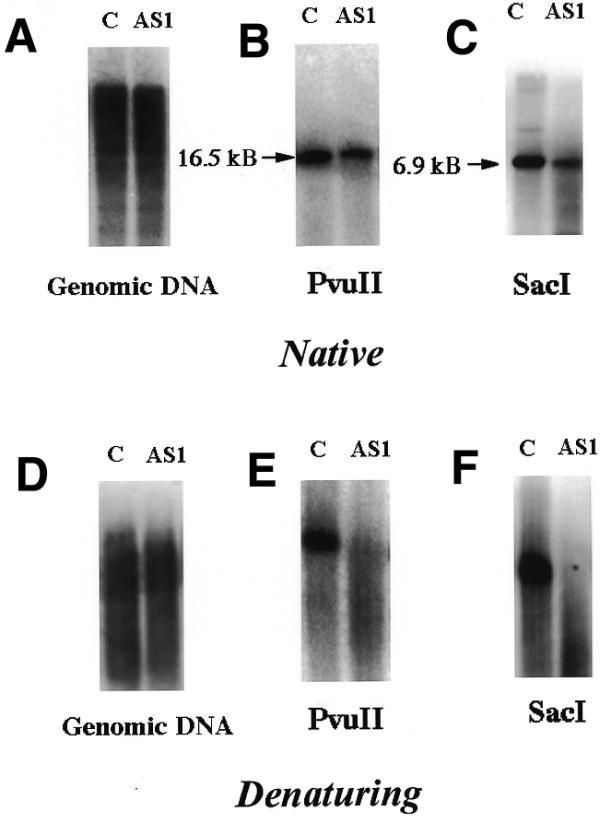
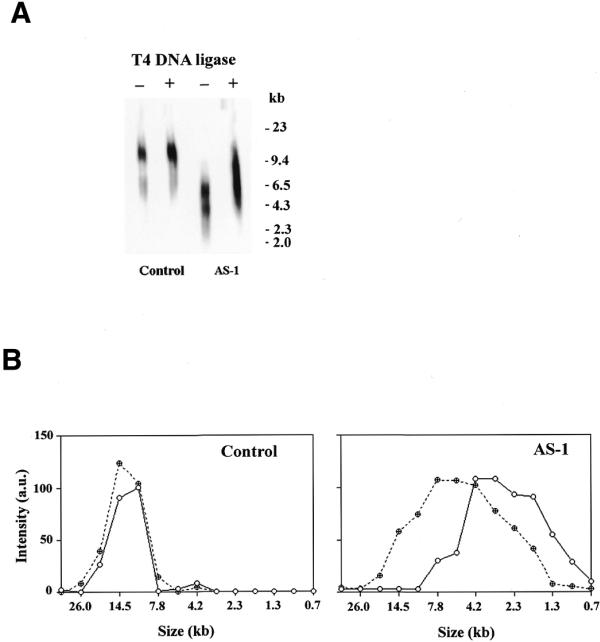
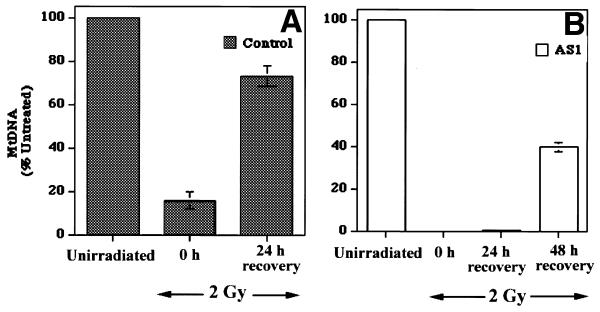
The human DNA ligase III gene encodes both nuclear and mitochondrial proteins. Abundant evidence supports the conclusion that the nuclear DNA ligase III protein plays an essential role in both base excision repair and homologous recombination. However, the role of DNA ligase III protein in mitochondrial genome dynamics has been obscure. Human tumor-derived HT1080 cells were transfected with an antisense DNA ligase III expression vector and clones with diminished levels of DNA ligase III activity identified. Mitochondrial protein extracts prepared from these clones had decreased levels of DNA ligase III relative to extracts from cells transfected with a control vector. Analysis of these clones revealed that the DNA ligase III antisense mRNA-expressing cells had reduced mtDNA content compared to control cells. In addition, the residual mtDNA present in these cells had numerous single-strand nicks that were not detected in mtDNA from control cells. Cells expressing antisense ligase III also had diminished capacity to restore their mtDNA to pre-irradiation levels following exposure to gamma-irradiation. An antisense-mediated reduction in cellular DNA ligase IV had no effect on the copy number or integrity of mtDNA. This observation, coupled with other evidence, suggests that DNA ligase IV is not present in the mitochondria and does not play a role in maintaining mtDNA integrity. We conclude that DNA ligase III is essential for the proper maintenance of mtDNA in cultured mammalian somatic cells.


Figures

Figure 1
Figure 1
Analysis of DNA ligase III antisense-expressing clones. (A) An aliquot of 10 µg total RNA from control and antisense cells was separated on a denaturing gel and transferred to a nylon membrane. The membranes were hybridized with an [α-32P]dATP-labeled probe corresponding to the DNA ligase III cDNA (nt 73–331). Lane 1, control; lane 2, AS1 cells; lane 3, AS2 cells. (B) (Left) An aliquot of 10 µg mitochondrial extracts from control (lane 1), AS1 (lane 2) and AS2 (lane 3) cell lines. Samples were boiled for 10 min following addition of buffer containing SDS and β-mercaptoethanol and loaded on a 10% SDS–polyacrylamide gel. The gel was stained with Coomassie brilliant blue. The mobility of protein size standards in kilodaltons is indicated. (Middle) Western blot analysis of 10 µg mitochondrial protein extracts from control (lane 1), AS1 (lane 2) and AS2 (lane 3) cell lines, probed with anti-ligase III antibody at a dilution of 1:500. The arrow indicates DNA ligase III protein. (Right) Protein adenylation pattern of 5 µg mitochondrial protein extracts prepared from control cells (lane 1) and from the DNA ligase III antisense-expressing clones AS1 (lane 2) and AS2 (lane 3). The arrow indicates the adenylated mtDNA ligase. The mobility of protein size standards in kilodaltons is indicated.
Figure 2
Figure 2
mtDNA contents in DNA ligase III antisense mRNA-expressing cells. (A) Southern blot analysis of 1 µg genomic DNA from control cells (lane 1) and clones AS1 (lane 2) and AS2 (lane 3) digested with PvuII and hybridized with a mtDNA probe. The arrow indicates the position of the 16.5 kb linearized mtDNA. (B) A plot of the adenylation activity of mitochondrial extracts versus the amount of mtDNA in control and DNA ligase III antisense mRNA-expressing cells. Southern blot analysis of 1 µg genomic DNA digested with PvuII and hybridized with a mtDNA probe. The amount of mtDNA and adenylation activity was quantified and the values obtained for AS cells normalized to the value obtained with control cells. The filled circle represents the control cell value and open circles represent the values obtained from DNA ligase III antisense mRNA-expressing cells.
Figure 3
Figure 3
Analysis of DNA ligase IV antisense mRNA-expressing cells. (A) An aliquot of 10 µg total RNA from control and antisense cells was separated on a denaturing gel, transferred to a nylon membrane and probed with an [α-32P]dATP-labeled fragment of DNA ligase IV cDNA (nt 2435–3423). (B) (Left) An aliquot of 5 µg nuclear protein extract made from the control cell line (lane 1) or from an antisense ligase IV-expressing cell line (lane 2) was separated by SDS–PAGE. The gel was stained with Coomassie brilliant blue to ensure equal loading. (Right) Western blot analysis of 5 µg nuclear protein extract from the control cell line (lane 1) or an antisense ligase IV-expressing cell line (lane 2) using polyclonal anti-ligase IV antibody (B) at a dilution of 1:1000. (C) Southern blot analysis using a mtDNA probe of 1 µg genomic DNA isolated from control (lane 1) and antisense ligase IV mRNA-expressing cells (lane 2). The arrow indicates the mobility of intact, linearized mtDNA (16.5 kb).
Figure 4
Figure 4
mtDNA from AS1 cells is damaged. Equal amounts of total genomic DNA from control (c) and AS1 (AS1) cells was digested with PvuII and separated on a 0.5% agarose gel under native or denaturing conditions (see Materials and Methods). (A and D) Genomic DNA digested with PvuII hybridized to a total genomic DNA probe. (B and E) Genomic DNA digested with PvuII and hybridized with a mtDNA probe. (C and F) Genomic DNA digested with SacI and hybridized to a mtDNA probe.
Figure 5
Figure 5
T4 DNA ligase treatment of mtDNA from control and AS1 cells. (A) Genomic DNA control and AS1 cells electrophoresed under denaturing conditions and hybridized with a mtDNA probe. –, no pretreatment; +, purified DNA treated with T4 DNA ligase prior to denaturation and electrophoresis. (B) Scanning densitometry was performed on the data presented above. (Left) DNA from control cell line; (right) DNA from AS1 cell line. Filled circles, pre-treatment with T4 DNA ligase; open circles, no pre-treatment with T4 DNA ligase. The sizes of the fragments were calculated based on the mobility of the band compared to a molecular weight standard.
Figure 6
Figure 6
Partial rescue of mtDNA amount and integrity of AS1 cells by overexpression of mitochondrial DNA ligase III. (A) Western blot analysis of mitochondrial extracts prepared from control cells, AS1 cells and AS1 cells overexpressing mitochondrial DNA ligase III. Aliquots of 10 mg mitochondrial extracts were separated by 10% SDS–PAGE and transferred to a nylon membrane. Blots were probed with anti-ligase III antibody at a 1:500 dilution. (B) The amount of mtDNA in control, AS1 cells and AS1 cells overexpressing mitochondrial DNA ligase III was measured. Genomic DNA digested with PvuII was separated on a 0.5% agarose gel under native conditions, transferred to a nylon membrane and probed with a portion of mtDNA. The mtDNA was quantified using IP Labgel. Three independent experiments were carried out and the average value obtained plotted as a graph. Standard errors of the mean are represented as error bars. (C) PvuII-digested genomic DNA from control cells, AS1 cells and AS1 cells overexpressing mitochondrial DNA ligase III was denatured in the presence of 0.2 N NaOH prior to electrophoresis on a 0.5% agarose gel. The blot was treated similarly to as described above.
Figure 7
Figure 7
Analysis of mtDNA following exposure of control and AS1 cells to γ-radiation. mtDNA content of control and AS1 cells at various times before and after exposure to 2 Gy radiation. Genomic DNA was isolated and Southern hybridization performed using a mtDNA specific probe as described (see Materials and Methods). Scanning densitometry was performed on data from three independent experiments. The mtDNA content present in each cell line at each time point was normalized to that present in untreated cells. (A) Control cells; (B) AS1 cells. Error bars indicate the standard error of the mean, n = 3.

References

    1. Applegren N., Hickey,R.J., Kleinschmidt,A.M., Zhou,Q.Q., Cell,J., Wills,P., Swaby,R., Wei,Y.T., Quan,J.Y., Lee,M.Y.W.T. and Malkas,L.H. (1995) Further characterization of the human cell multiprotein DNA replication complex. J. Cell. Biochem., 59, 91–107. - PubMed
    1. Turchi J.J., Huang,L., Murante,R.S., Kim,Y. and Bambara,R.A. (1994) Enzymatic completion of mammalian lagging-strand DNA replication. Proc. Natl Acad. Sci. USA, 91, 9803–9807. - PMC - PubMed
    1. Waga S., Bauer,G. and Stillman,B. (1994) Reconstitution of complete SV40 replication with purified replication factors. J. Biol. Chem., 69, 10923–10934. - PubMed
    1. Montecucco A., Savini,E., Biamonti,G., Stefanini,M., Focher,F. and Ciarrocchi,G. (1995) Late induction of human DNA ligase I after UV-C irradiation. Nucleic Acids Res., 23, 962–966. - PMC - PubMed
    1. Aboussekhra A., Biggerstaff,M., Shivji,M.K.K., Vilpo,J.A., Moncollin,V., Podust,V.N., Protic,M., Hubscher,U., Egly,J.M. and Wood,R.D. (1995) Mammalian DNA nucleotide excision repair reconstituted with purified protein components. Cell, 80, 859–868. - PubMed

Publication types

MeSH terms