. 2001 Feb 1;29(3):818-30.
doi: 10.1093/nar/29.3.818.

Digging for dead genes: an analysis of the characteristics of the pseudogene population in the Caenorhabditis elegans genome

Affiliations

Digging for dead genes: an analysis of the characteristics of the pseudogene population in the Caenorhabditis elegans genome

P M Harrison et al. Nucleic Acids Res. .

Abstract

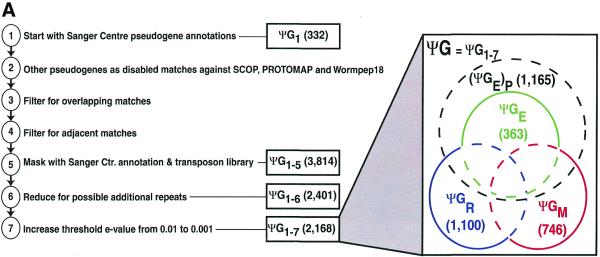
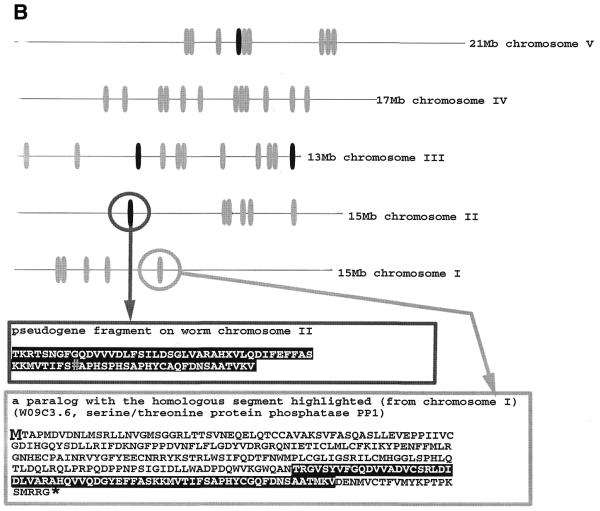
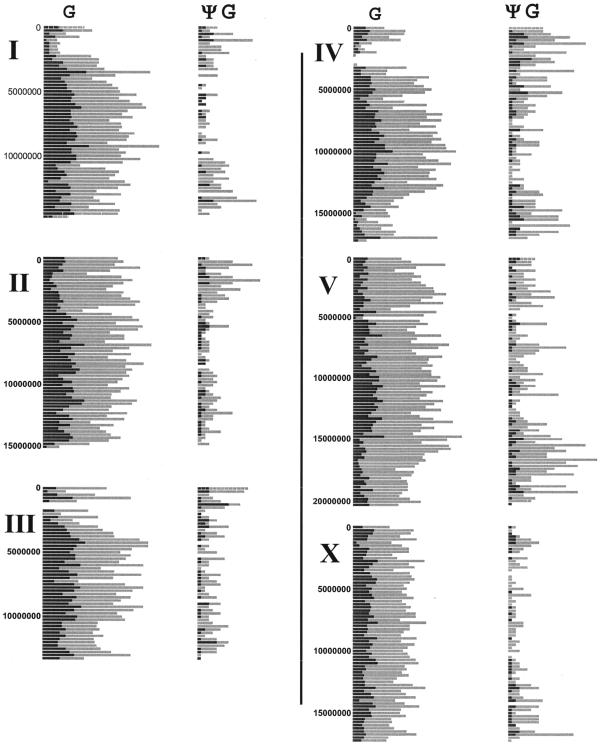
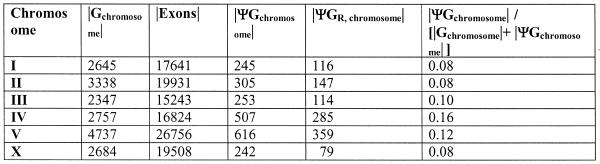
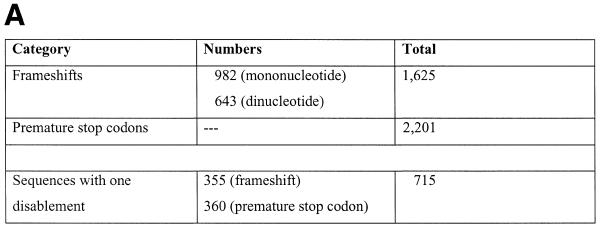
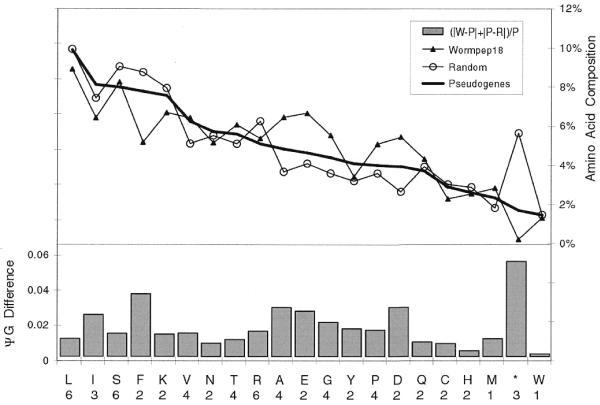
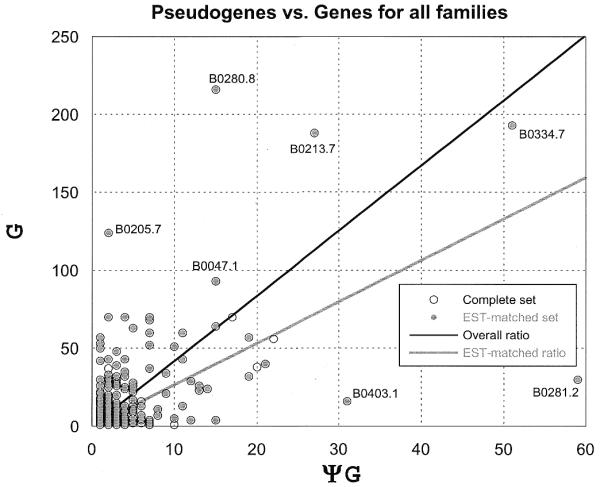
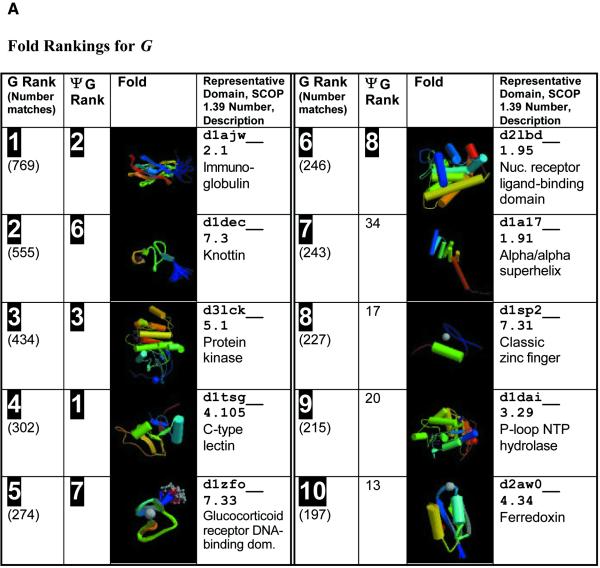
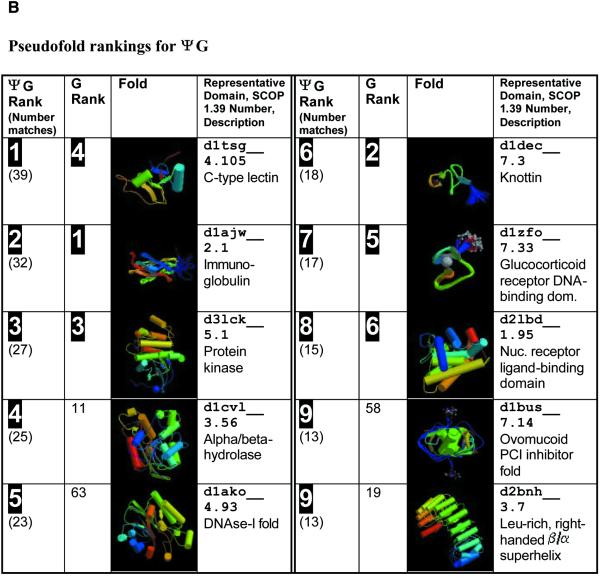
Pseudogenes are non-functioning copies of genes in genomic DNA, which may either result from reverse transcription from an mRNA transcript (processed pseudogenes) or from gene duplication and subsequent disablement (non-processed pseudogenes). As pseudogenes are apparently 'dead', they usually have a variety of obvious disablements (e.g., insertions, deletions, frameshifts and truncations) relative to their functioning homologs. We have derived an initial estimate of the size, distribution and characteristics of the pseudogene population in the Caenorhabditis elegans genome, performing a survey in 'molecular archaeology'. Corresponding to the 18 576 annotated proteins in the worm (i.e., in Wormpep18), we have found an estimated total of 2168 pseudogenes, about one for every eight genes. Few of these appear to be processed. Details of our pseudogene assignments are available from http://bioinfo.mbb.yale.edu/genome/worm/pseudogene. The population of pseudogenes differs significantly from that of genes in a number of respects: (i) pseudogenes are distributed unevenly across the genome relative to genes, with a disproportionate number on chromosome IV; (ii) the density of pseudogenes is higher on the arms of the chromosomes; (iii) the amino acid composition of pseudogenes is midway between that of genes and (translations of) random intergenic DNA, with enrichment of Phe, Ile, Leu and Lys, and depletion of Asp, Ala, Glu and Gly relative to the worm proteome; and (iv) the most common protein folds and families differ somewhat between genes and pseudogenes-whereas the most common fold found in the worm proteome is the immunoglobulin fold and the most common 'pseudofold' is the C-type lectin. In addition, the size of a gene family bears little overall relationship to the size of its corresponding pseudogene complement, indicating a highly dynamic genome. There are in fact a number of families associated with large populations of pseudogenes. For example, one family of seven-transmembrane receptors (represented by gene B0334.7) has one pseudogene for every four genes, and another uncharacterized family (represented by gene B0403.1) is approximately two-thirds pseudogenic. Furthermore, over a hundred apparent pseudogenic fragments do not have any obvious homologs in the worm.


Figures

Figure 1
Figure 1
(A) Schematic showing the derivation of the ΨG data set and its breakdown into subsets. The steps in the derivation of ΨG are summarized in Materials and Methods. The size of ΨG is indicated for the last two steps in this procedure. The name ΨG1–x indicates ΨG after x steps. The final ΨG data set comprises 2168 sequences. The subsets ΨGM, ΨGR, ΨGE and Ψ(GE)P that are mentioned in the text are indicated as a Venn diagram. (B) An example of a paralog family with associated pseudogenes. The positions of genes for the paralog family whose representative is the sequence C02F4.2, are indicated by grey ovals (totaling 40). The pseudogenes are marked with black ovals (totaling 4). A pseudogene fragment (ΨC02F4.2) from chromosome II is shown along with an example of a gene from this paralog family W09C3.6 (which is for a serine/threonine protein phosphatase PP1) with the homologous segment underlined. The pseudogene is interrupted by a frameshift relative to this gene (marked by #). The corresponding sequence in the gene paralog is boxed in black. This corresponds to one exon of the gene paralog. *, stop codon.
Figure 1
Figure 1
(A) Schematic showing the derivation of the ΨG data set and its breakdown into subsets. The steps in the derivation of ΨG are summarized in Materials and Methods. The size of ΨG is indicated for the last two steps in this procedure. The name ΨG1–x indicates ΨG after x steps. The final ΨG data set comprises 2168 sequences. The subsets ΨGM, ΨGR, ΨGE and Ψ(GE)P that are mentioned in the text are indicated as a Venn diagram. (B) An example of a paralog family with associated pseudogenes. The positions of genes for the paralog family whose representative is the sequence C02F4.2, are indicated by grey ovals (totaling 40). The pseudogenes are marked with black ovals (totaling 4). A pseudogene fragment (ΨC02F4.2) from chromosome II is shown along with an example of a gene from this paralog family W09C3.6 (which is for a serine/threonine protein phosphatase PP1) with the homologous segment underlined. The pseudogene is interrupted by a frameshift relative to this gene (marked by #). The corresponding sequence in the gene paralog is boxed in black. This corresponds to one exon of the gene paralog. *, stop codon.
Figure 2
Figure 2
The estimated chromosomal distribution of pseudogenes. Each panel depicts the distribution of genes (left) and pseudogenes (right) for the chromosomes I, II, III, IV, V, X. The EST-matched subsets for each chromosome are binned as a dark grey bar with the remainder of the gene’s pseudogenes as a light grey bar. The bin size is 250 000 bases. The axis for number of pseudogenes is scaled by two (X2) relative to the same axis for genes. The total estimated sizes of the chromosomal populations of pseudogenes are as follows (the columns are chromosome name, total number of genes, total number of exons for genes, total number of pseudogenes and the proportion of ‘dead’ gene copies):
Figure 2
Figure 2
The estimated chromosomal distribution of pseudogenes. Each panel depicts the distribution of genes (left) and pseudogenes (right) for the chromosomes I, II, III, IV, V, X. The EST-matched subsets for each chromosome are binned as a dark grey bar with the remainder of the gene’s pseudogenes as a light grey bar. The bin size is 250 000 bases. The axis for number of pseudogenes is scaled by two (X2) relative to the same axis for genes. The total estimated sizes of the chromosomal populations of pseudogenes are as follows (the columns are chromosome name, total number of genes, total number of exons for genes, total number of pseudogenes and the proportion of ‘dead’ gene copies):
Figure 3
Figure 3
Disablements, length and composition for ΨG. (A) Simple disablements. This data is only for the ΨG population directly derived from Wormpep18. (B) Length distribution of pseudogene matches. The distribution of pseudogene match lengths (in nucleotides) is shown as a dotted line, and of lengths for worm gene exons by a solid line. The lengths of the Sanger Centre annotated genes are not included as these are more carefully parsed predictions arising from a gene prediction algorithm. Each point n, the count of exons or matches for an interval from n to 50n. Every fourth point is indicated on the x-axis. (C) Composition for ΨG. The amino acid composition of the Wormpep18 database is compared to the implied amino acid composition of random non-repetitive genomic sequence and the ΨG population. The percentage composition for each of the 20 amino acids is graphed in decreasing order of the implied amino acid composition in the pseudogene set. In the bottom part of the figure, the ΨG difference for each amino acid composition is indicated by a bar. This is defined as (|wp| + |pr|)/p, where w is the amino acid composition value for the Wormpep18 proteins, r is the implied composition for random genomic sequence and p is the implied pseudogene composition. *, termination codons. The number of codons for each amino acid type is written below the one-letter code for the residue.
Figure 3
Figure 3
Disablements, length and composition for ΨG. (A) Simple disablements. This data is only for the ΨG population directly derived from Wormpep18. (B) Length distribution of pseudogene matches. The distribution of pseudogene match lengths (in nucleotides) is shown as a dotted line, and of lengths for worm gene exons by a solid line. The lengths of the Sanger Centre annotated genes are not included as these are more carefully parsed predictions arising from a gene prediction algorithm. Each point n, the count of exons or matches for an interval from n to 50n. Every fourth point is indicated on the x-axis. (C) Composition for ΨG. The amino acid composition of the Wormpep18 database is compared to the implied amino acid composition of random non-repetitive genomic sequence and the ΨG population. The percentage composition for each of the 20 amino acids is graphed in decreasing order of the implied amino acid composition in the pseudogene set. In the bottom part of the figure, the ΨG difference for each amino acid composition is indicated by a bar. This is defined as (|wp| + |pr|)/p, where w is the amino acid composition value for the Wormpep18 proteins, r is the implied composition for random genomic sequence and p is the implied pseudogene composition. *, termination codons. The number of codons for each amino acid type is written below the one-letter code for the residue.
Figure 4
Figure 4
Plot of the number of genes in a paralog family (Gfamily) versus the number of pseudogenes in a paralog family (ΨGfamily). The families from the GE set are marked as closed points, with the remainder as open points. The lines indicate the overall ratio of the number of genes to the number of pseudogenes for the whole genome and for the GE subset. Families with large numbers of genes and/or pseudogenes are labeled with the name of their family representative.
Figure 5
Figure 5
The folds and pseudofolds in the worm genome. (A) The SCOP domain matches are extrapolated onto Wormpep18 from assignments made previously on Wormpep17 proteins (23). (B) Pseudofold assignments are taken from the closest matching gene paralog for each pseudogene. The columns are as follows: rank for folds or pseudofolds (with total numbers in parentheses); corresponding rank for pseudofolds or folds; a fold cartoon; the representative domain, the SCOP 1.39 domain number and a brief description of the fold. The fold cartoons are coloured in a sliding gradient from blue for the N-terminus to red for the C-terminus.
Figure 5
Figure 5
The folds and pseudofolds in the worm genome. (A) The SCOP domain matches are extrapolated onto Wormpep18 from assignments made previously on Wormpep17 proteins (23). (B) Pseudofold assignments are taken from the closest matching gene paralog for each pseudogene. The columns are as follows: rank for folds or pseudofolds (with total numbers in parentheses); corresponding rank for pseudofolds or folds; a fold cartoon; the representative domain, the SCOP 1.39 domain number and a brief description of the fold. The fold cartoons are coloured in a sliding gradient from blue for the N-terminus to red for the C-terminus.

References

    1. Weiner A.M., Deininger,P.L. and Efstratiadis,A. (1986) Non-viral retroposons: genes, pseudogenes and transposable elements generated by the reverse flow of genetic information. Annu. Rev. Biochem., 55, 631–661. - PubMed
    1. Vanin E.F. (1985) Processed pseudogenes: characteristics and evolution. Annu. Rev. Genet., 19, 253–272. - PubMed
    1. Mighell A.J., Smith,N.R., Robinson,P.A. and Markham,A.F. (2000) Vertebrate pseudogenes. FEBS Lett., 468, 109–114. - PubMed
    1. Korneev S.A., Park,J.-H. and O’Shea,M. (1999) Neuronal expression of neural nitric oxide synthase (nNOS) protein is suppressed by an antisense RNA transcribed from an NOS pseudogene. J. Neurosci., 19, 7711–7720. - PMC - PubMed
    1. Olsen M.A. and Schechter,L.E. (1999) Cloning, mRNA localization and evolutionary conservation of a human 5HT7 receptor pseudogene. Gene, 227, 63–69. - PubMed

Publication types