. 2001 Feb 15;29(4):943-54.
doi: 10.1093/nar/29.4.943.

Protein-RNA interactions: a structural analysis

Affiliations

Protein-RNA interactions: a structural analysis

S Jones et al. Nucleic Acids Res. .

Abstract

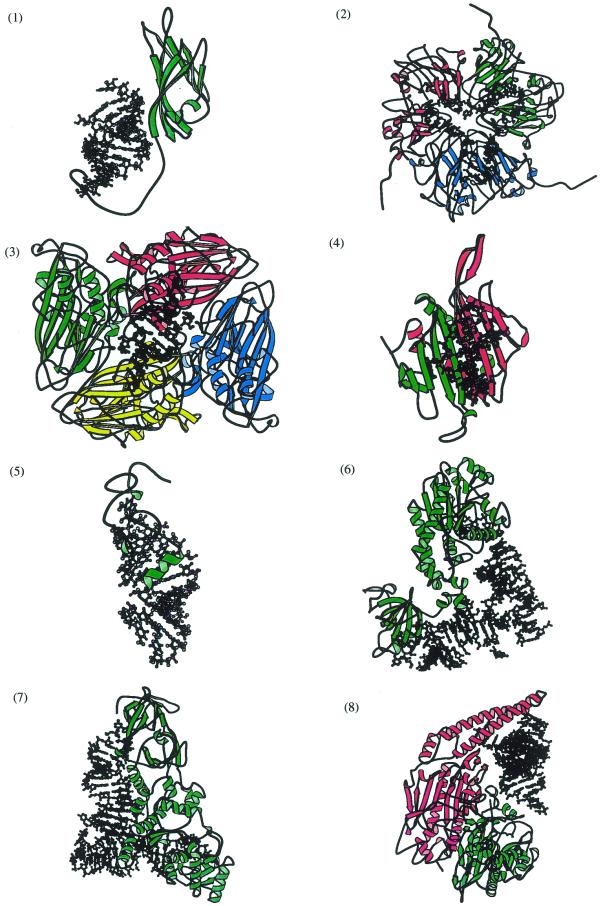
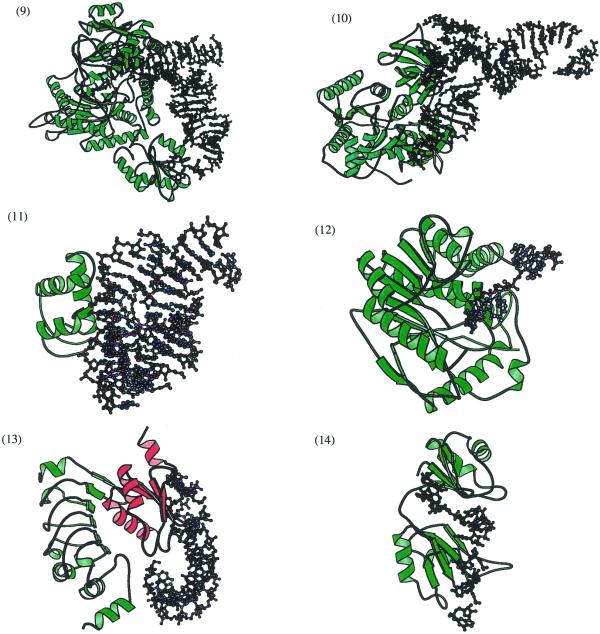
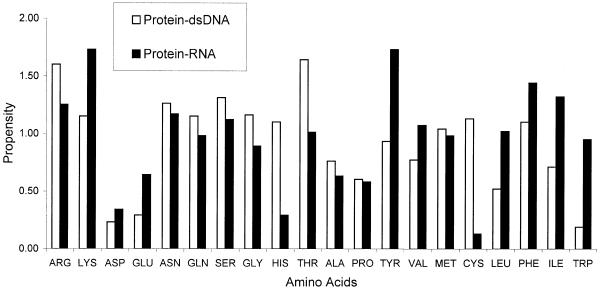
A detailed computational analysis of 32 protein-RNA complexes is presented. A number of physical and chemical properties of the intermolecular interfaces are calculated and compared with those observed in protein-double-stranded DNA and protein-single-stranded DNA complexes. The interface properties of the protein-RNA complexes reveal the diverse nature of the binding sites. van der Waals contacts played a more prevalent role than hydrogen bond contacts, and preferential binding to guanine and uracil was observed. The positively charged residue, arginine, and the single aromatic residues, phenylalanine and tyrosine, all played key roles in the RNA binding sites. A comparison between protein-RNA and protein-DNA complexes showed that whilst base and backbone contacts (both hydrogen bonding and van der Waals) were observed with equal frequency in the protein-RNA complexes, backbone contacts were more dominant in the protein-DNA complexes. Although similar modes of secondary structure interactions have been observed in RNA and DNA binding proteins, the current analysis emphasises the differences that exist between the two types of nucleic acid binding protein at the atomic contact level.


Figures

Figure 1
Figure 1
MOLSCRIPT diagrams depicting protein–RNA complexes. One complex from each of the 14 families in Table 1 is presented. The sizes of the proteins are not comparable between diagrams and each is viewed from an angle that best depicts both the protein and RNA. In each diagram the RNA molecule is shown in ball-and-stick format and the proteins in ribbon format. Different subunits of the same protein are differentiated by colour. (1) Coat protein from Satellite tobacco mosaic virus (1A34); (2) bean pod mottle virus (middle component) (1BMV); (3) black beetle virus capsid protein (2BBV); (4) MS2 protein capsid (1ZDI); (5) HIV-1 nucleocapsid protein (1A1T); (6) aspartyl tRNA synthetase (1ASY); (7) glutaminyl tRNA synthetase (1QTQ); (8) seryl tRNA synthetase (1SER); (9) threonyl tRNA synthetase (1QF6); (10) elongation factor EF-TU (1TTT); (11) ribosomal protein L11 (1QA6); (12) methyltransferase VP39 (1AV6); (13) spliceosomal U2B″/U2A′ complex (1A9N); (14) sex-lethal protein (1B7F).
Figure 1
Figure 1
MOLSCRIPT diagrams depicting protein–RNA complexes. One complex from each of the 14 families in Table 1 is presented. The sizes of the proteins are not comparable between diagrams and each is viewed from an angle that best depicts both the protein and RNA. In each diagram the RNA molecule is shown in ball-and-stick format and the proteins in ribbon format. Different subunits of the same protein are differentiated by colour. (1) Coat protein from Satellite tobacco mosaic virus (1A34); (2) bean pod mottle virus (middle component) (1BMV); (3) black beetle virus capsid protein (2BBV); (4) MS2 protein capsid (1ZDI); (5) HIV-1 nucleocapsid protein (1A1T); (6) aspartyl tRNA synthetase (1ASY); (7) glutaminyl tRNA synthetase (1QTQ); (8) seryl tRNA synthetase (1SER); (9) threonyl tRNA synthetase (1QF6); (10) elongation factor EF-TU (1TTT); (11) ribosomal protein L11 (1QA6); (12) methyltransferase VP39 (1AV6); (13) spliceosomal U2B″/U2A′ complex (1A9N); (14) sex-lethal protein (1B7F).
Figure 2
Figure 2
Histogram of the interface residue propensities calculated for the protein–RNA complexes and compared to a dataset of protein–dsDNA complexes (25). A propensity of more than one denotes that a residue occurs more frequently in the protein–nucleic acid interface than in the remainder of the protein surface. The amino acid residues on the x-axis are ordered according to the Fauchere and Pliska (39) hydrophobicity scale, moving from the most hydrophilic residues on the left-hand side to the most hydrophobic on the right.

References

    1. Moore P.B. (1998) The three-dimensional structure of the ribosome and its components. Annu. Rev. Biophys. Biomol. Struct., 27, 35–58. - PubMed
    1. Ramakrishnan V. and White,S.W. (1998) Ribosomal protein structures: insights into the architecture, machinery and evolution of the ribosome. Trends Biochem. Sci., 23, 208–212. - PubMed
    1. Luhrmann R., Kastner,B. and Bach,M. (1990) Structure of spliceosomal snRNP’s and their role in pre-mRNA splicing. Biochim. Biophys. Acta, 1087, 265–292. - PubMed
    1. Tarasow T.M. and Eaton,B.E. (1998) Dressed for success: realising the catalytic potential of RNA. Biopolymers ,48, 29–37.
    1. Scott W.G. and Klug,A. (1996) Ribozymes: structures and mechanism in RNA catalysis. Trends Biochem. Sci., 21, 220–224. - PubMed

Publication types