

Hybridization of single-stranded DNA targets to immobilized complementary DNA probes: comparison of hairpin versus linear capture probes
- PMID: 11160933
- PMCID: PMC29612
- DOI: 10.1093/nar/29.4.996
Hybridization of single-stranded DNA targets to immobilized complementary DNA probes: comparison of hairpin versus linear capture probes
Abstract
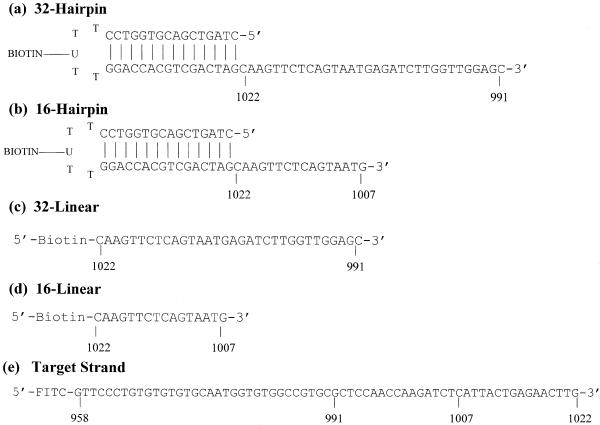
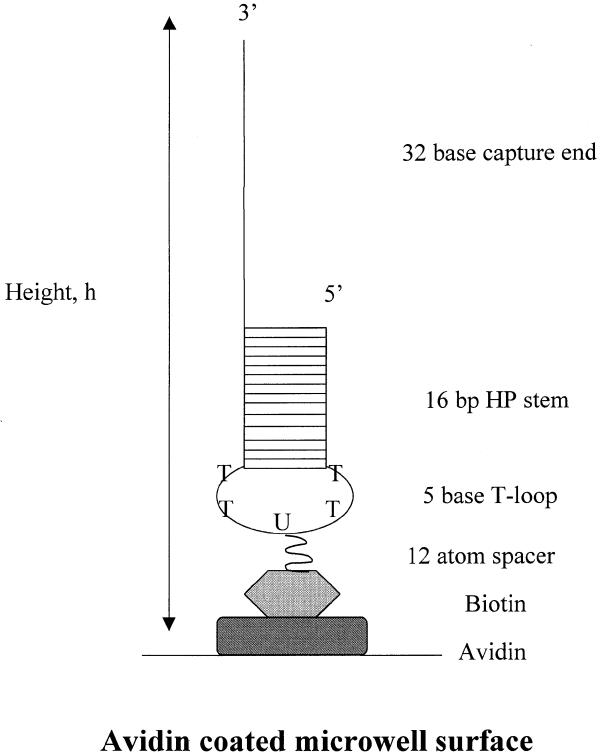
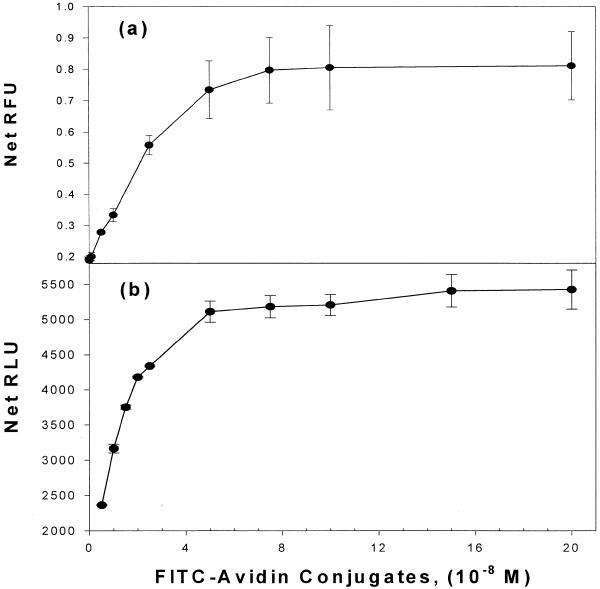
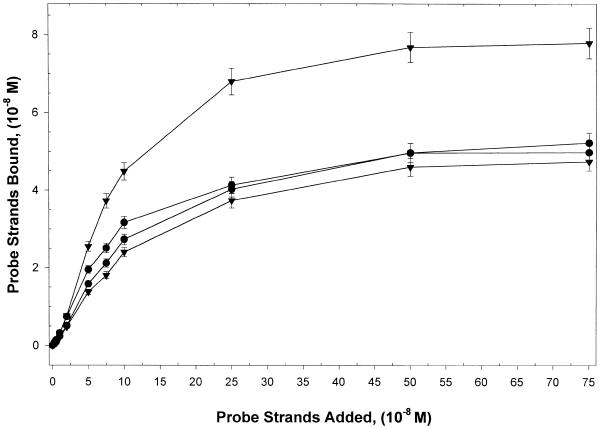
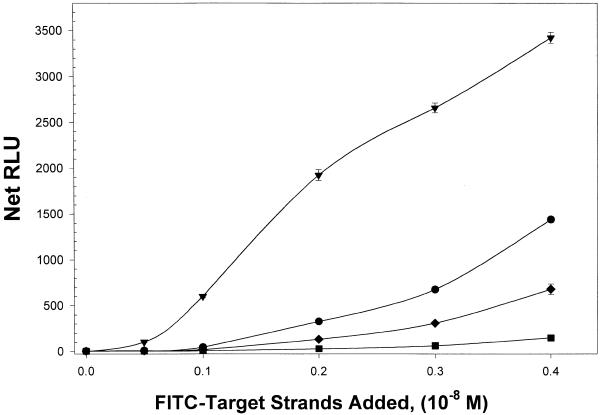
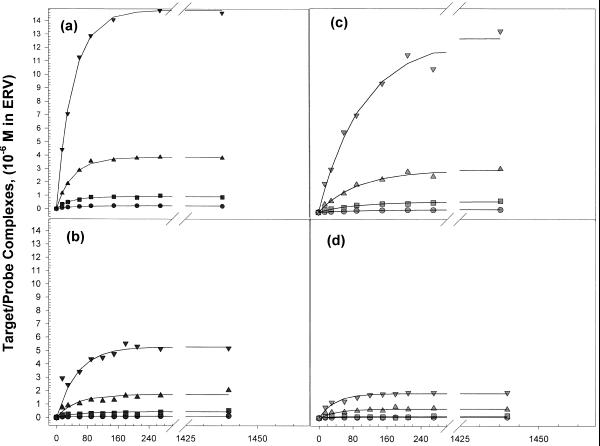
A microtiter-based assay system is described in which DNA hairpin probes with dangling ends and single-stranded, linear DNA probes were immobilized and compared based on their ability to capture single-strand target DNA. Hairpin probes consisted of a 16 bp duplex stem, linked by a T(2)-biotin.dT-T(2) loop. The third base was a biotinylated uracil (U(B)) necessary for coupling to avidin coated microtiter wells. The capture region of the hairpin was a 3' dangling end composed of either 16 or 32 bases. Fundamental parameters of the system, such as probe density and avidin adsorption capacity of the plates were characterized. The target DNA consisted of 65 bases whose 3' end was complementary to the dangling end of the hairpin or to the linear probe sequence. The assay system was employed to measure the time dependence and thermodynamic stability of target hybridization with hairpin and linear probes. Target molecules were labeled with either a 5'-FITC, or radiolabeled with [gamma-(33)P]ATP and captured by either linear or hairpin probes affixed to the solid support. Over the range of target concentrations from 10 to 640 pmol hybridization rates increased with increasing target concentration, but varied for the different probes examined. Hairpin probes displayed higher rates of hybridization and larger equilibrium amounts of captured targets than linear probes. At 25 and 45 degrees C, rates of hybridization were better than twice as great for the hairpin compared with the linear capture probes. Hairpin-target complexes were also more thermodynamically stable. Binding free energies were evaluated from the observed equilibrium constants for complex formation. Results showed the order of stability of the probes to be: hairpins with 32 base dangling ends > hairpin probes with l6 base dangling ends > 16 base linear probes > 32 base linear probes. The physical characteristics of hairpins could offer substantial advantages as nucleic acid capture moieties in solid support based hybridization systems.
Figures
References
-
- Duggan D.J., Bittner,M., Chen,Y., Meltzer,P. and Trent,J.M. (1999) Expression profiling using cDNA microarrays. Nature Genet., 21 (Suppl.), 10–14. - PubMed
-
- Lipshutz R.J., Morris,D., Chee,M., Hubbell,E., Kozal,M.J., Shah,N., Shen,N., Yang,R. and Fodor,S.P.A. (1995) Using oligonucleotide probe arrays to access genetic diversity. Biotechniques, 19, 442–447. - PubMed
-
- O’Donnell-Maloney M.J., Smith,C.L. and Cantor,C.R. (1996) The development of microfabricated arrays for DNA sequencing and analysis. Trends Biochem. Technol., 14, 401–407. - PubMed
-
- de Saizieu A., Certa,U., Warrington,J., Gray,C., Keck,W. and Mous,J. (1998) Bacterial transcript imaging by hybridization of total RNA to oligonucleotide arrays. Nature Biotechnol., 16, 45–48. - PubMed
-
- Southern E.M, Mir,K. and Shchepinov,M. (1999) Molecular interactions on microarrays. Nature Genet., 21 (Suppl.), 5–9. - PubMed
MeSH terms
Substances
LinkOut - more resources
Full Text Sources
Other Literature Sources
