. 2001 Feb 15;29(4):E25.
doi: 10.1093/nar/29.4.e25.

Diversity arrays: a solid state technology for sequence information independent genotyping

Affiliations

Diversity arrays: a solid state technology for sequence information independent genotyping

D Jaccoud et al. Nucleic Acids Res. .

Abstract

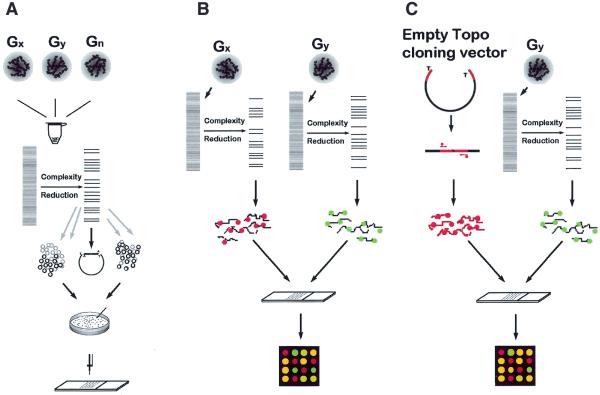
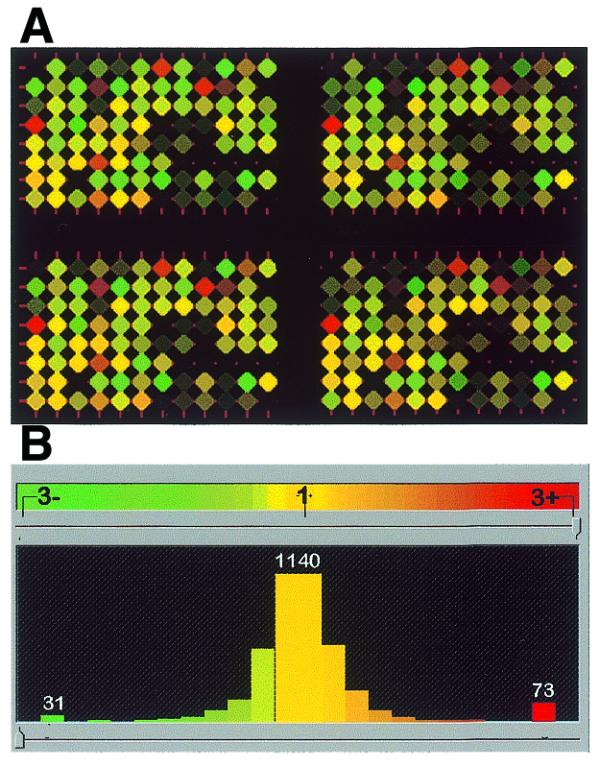
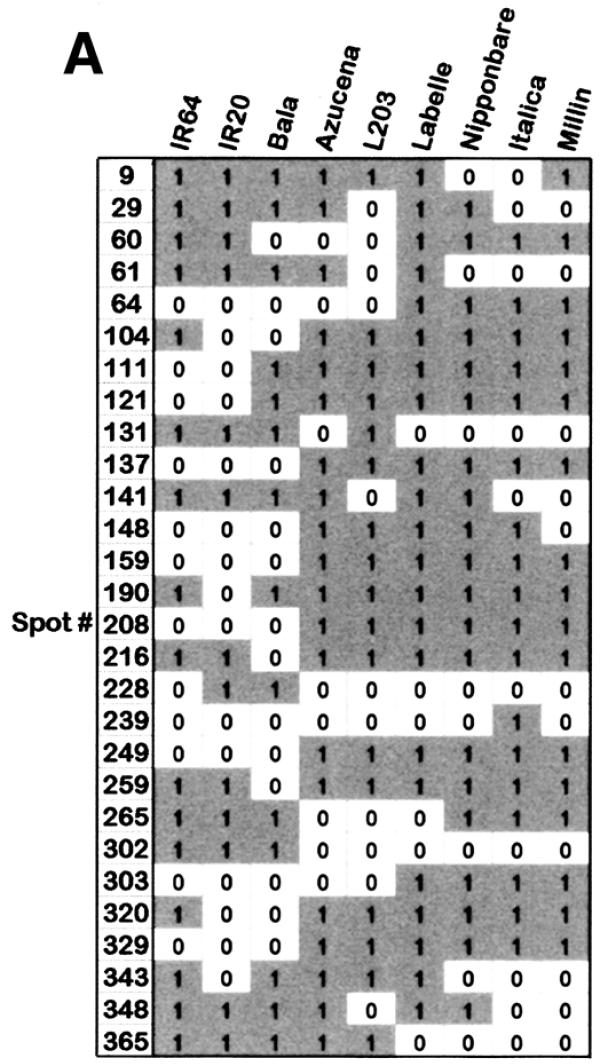
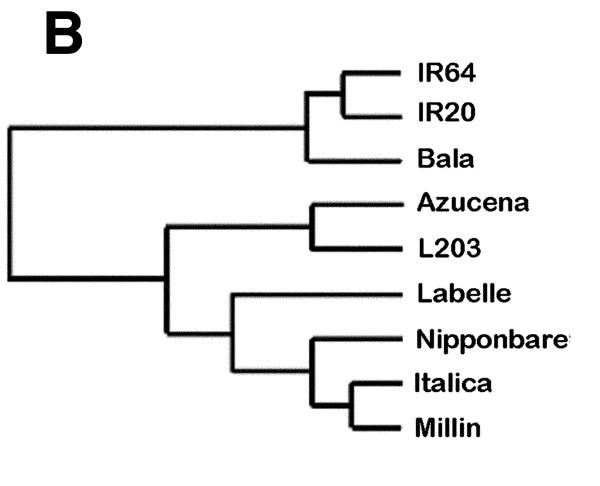
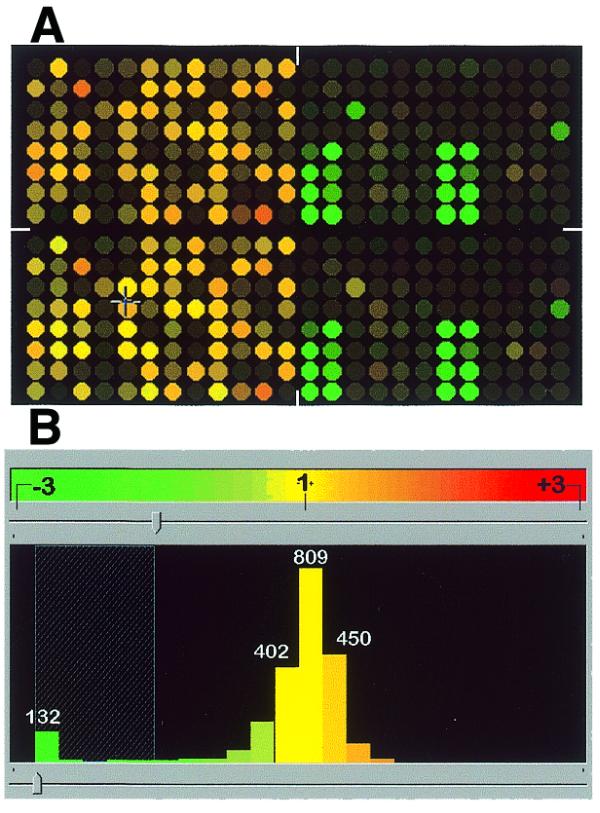
Here we present the successful application of the microarray technology platform to the analysis of DNA polymorphisms. Using the rice genome as a model, we demonstrate the potential of a high-throughput genome analysis method called Diversity Array Technology, DArT'. In the format presented here the technology is assaying for the presence (or amount) of a specific DNA fragment in a representation derived from the total genomic DNA of an organism or a population of organisms. Two different approaches are presented: the first involves contrasting two representations on a single array while the second involves contrasting a representation with a reference DNA fragment common to all elements of the array. The Diversity Panels created using this method allow genetic fingerprinting of any organism or group of organisms belonging to the gene pool from which the panel was developed. Diversity Arrays enable rapid and economical application of a highly parallel, solid-state genotyping technology to any genome or complex genomic mixtures.


Figures

Figure 1
Figure 1
Schematic representation of DArT. (A) Generation of Diversity Panels. Genomic DNAs of specimens to be studied are pooled together. The DNA is cut with a chosen restriction enzyme and ligated to adapters. The genome complexity is reduced in this case by PCR using primers with selective overhangs. The fragments from representations are cloned. Cloned inserts are amplified using vector-specific primers, purified and arrayed onto a solid support. (B) Contrasting two samples using DArT. Two genomic samples are converted to representations using the same methods as in (A). Each representation is labelled with a green or red fluorescent dye, mixed and hybridised to the Diversity Panel. The ratio of green:red signal intensity is measured at each array feature. Significant differences in the signal ratio indicate array elements (and the relevant fragment of the genome) for which the two samples differ. (C) Genetic fingerprinting using DArT. The DNA sample for analysis is converted to a representation using the methods as in (A) and labelled with green fluorescent dye. Fragments of the cloning vector, which are common to all elements of the array (polylinker of PCR2.1-TOPO vector, marked red), are labelled with red fluorescent dye and hybridised to a Diversity Panel together with green fluorescence-labelled representation. First the ratio of signal intensity is measured at each array feature for each input genotype used to generate Diversity Panels. Polymorphic spots are identified by binary distribution of signal ratios among input samples. Any new specimen can be assayed on arrays of polymorphic features to generate a genetic fingerprint.
Figure 2
Figure 2
Differences between two rice cultivars, IR64 and Millin, detected using EcoRI Diversity Panels and Pathways image analysis program. (A) Synthetic array image of 96 spots printed four times from the EcoRI Diversity Panel. The rice cultivars IR64 and Millin were labelled with Cy3-green and Cy5-red, respectively. Files of scanned images of the whole array are available at http://farm.cambia.org.au/Nucleic_Acids/. (B) Histogram of green:red normalised signal intensity ratios shows trimodal distribution. The majority of the array features show signal intensity ratios ~1, indicating equal hybridisation intensity for Millin and IR64. The green and red ‘tails’ seen at signal intensity ratios >2.9 indicate features of the Diversity Panel that differentiate IR64 and Millin DNA.
Figure 3
Figure 3
Validation of DArT-identified polymorphisms using genomic and subgenomic Southern blot technique. Two clones (F4 and F8), representing the two polymorphic features on the EcoRI Diversity panel were used as molecular probes. Four varieties of rice were analysed simultaneously: lane 1, Bala; lane 2, Millin; lane 3, IR64; lane 4, IR20. (A) Probe F4 and F8 hybridisation to the EcoRI genomic Southern blots. (B) Probe F4 and F8 hybridisation to the Southern blot of representations generated from genomic samples analysed in (A).
Figure 4
Figure 4
Examples of green:red signal ratio distributions for spots from the MspI Diversity panel among nine rice cultivars (two replica slides per cultivar). (A) Cumulative distribution function of log-transformed normalised signal ratios for four different non-polymorphic spots across 18 different slides. Classification of the spots as non-polymorphic is based on the monomodal distribution of the ratios across all slides. (B) Cumulative distribution function of log-transformed normalised signal ratios for four different polymorphic spots across 18 different slides. Classification of the spots as polymorphic spots is based on a clear bimodal distribution across all slides. The algorithm calculates the best value for separation of the high (value of 1) and low (value of 0) clusters shown as an ‘×’ on the curves.
Figure 5
Figure 5
Genetic variation detected on the MspI Diversity Panel among nine rice cultivars. (A) A table of binary scores for cultivars analysed at polymorphic spots. Each cultivar was analysed with two slides, but since all replicates were classified as being the same, only one score per spot is presented for each cultivar. (B) Dendrogram generated from the MspI Diversity Panel. The binary scoring table of 28 unique features from the MspI panel was analysed by Cluster program (Stanford) using similarity metric setting of correlation uncentered and presented by treeview (Stanford). Differentiation among the cultivars analysed and separation between japonica- and indica-types is apparent in the dendrogram.
Figure 5
Figure 5
Genetic variation detected on the MspI Diversity Panel among nine rice cultivars. (A) A table of binary scores for cultivars analysed at polymorphic spots. Each cultivar was analysed with two slides, but since all replicates were classified as being the same, only one score per spot is presented for each cultivar. (B) Dendrogram generated from the MspI Diversity Panel. The binary scoring table of 28 unique features from the MspI panel was analysed by Cluster program (Stanford) using similarity metric setting of correlation uncentered and presented by treeview (Stanford). Differentiation among the cultivars analysed and separation between japonica- and indica-types is apparent in the dendrogram.
Figure 6
Figure 6
A reconstruction experiment using mixed (rice and several microorganisms) Diversity panels. ‘Clean’ Millin representation was labelled with red fluorescent dye and Enterobacter ’contaminated’ Millin representation was labelled with green fluorescent dye. The synthetic image and histogram were created using Pathways. (A) The left half of the array (mostly yellow features) represents the rice MspI panel. The right half of the array contains features from MspI panels from seven bacterial species and one from yeast. Green spots in the right part of the array correspond to the elements of the panel developed from the same Enterobacter DNA source as the one ‘spiked’ into Millin DNA. (B) Histogram of the signal ratios for the array presented in (A). The Enterobacter spike is detected as the ‘green’ left tail of the distribution.

References

    1. Botstein D., White,R., Skolnick,M. amd Davis,R. (1980) Construction of a genetic linkage map in man using restriction fragment length polymorphisms. Am. J. Hum. Genet., 32, 314–331. - PMC - PubMed
    1. Weber J. and May,P. (1989) Abundant class of human DNA polymorphisms which can be typed using the polymerase chain reaction. Am. J. Hum. Genet., 44, 388–396. - PMC - PubMed
    1. Williams J., Kubelik,A., Livak,K., Rafalski,J. and Tingey,S. (1990) DNA polymorphisms amplified by arbitrary primers are useful as genetic markers. Nucleic Acids Res., 18, 6531–6535. - PMC - PubMed
    1. Vos P., Hogers,R., Bleeker,M., Reijans,M., van de Lee,T., Hornes,M., Frijters,A., Pot,J., Peleman,J., Kuiper,M. et al. (1995) AFLP: a new technique for DNA fingerprinting. Nucleic Acids Res., 23, 4407–4414. - PMC - PubMed
    1. Guilfoyle R., Leeck,C., Kroening,K., Smith,L. and Guo,Z. (1997) Ligation-mediated PCR amplification of specific fragments from a class-II restriction endonuclease total digest. Nucleic Acids Res., 25, 1854–1858. - PMC - PubMed

Publication types