

The calcium rhythms of different cell types oscillate with different circadian phases
- PMID: 11161036
- PMCID: PMC64880
- DOI: 10.1104/pp.125.2.787
The calcium rhythms of different cell types oscillate with different circadian phases
Abstract
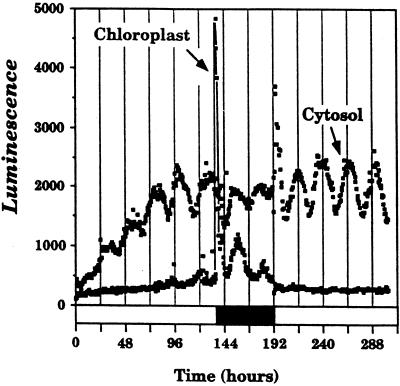
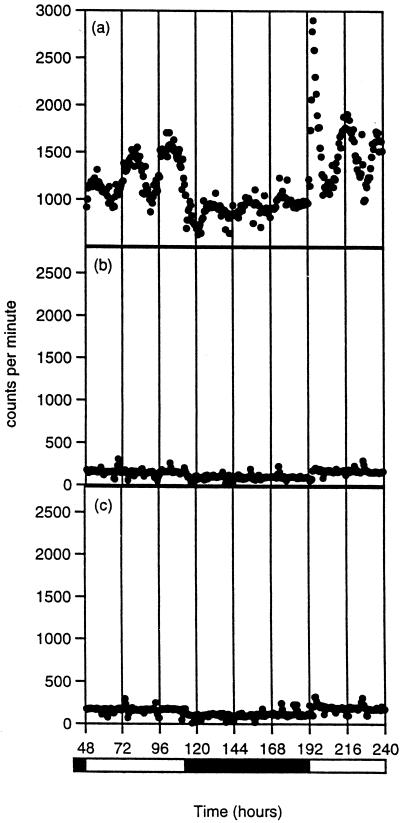
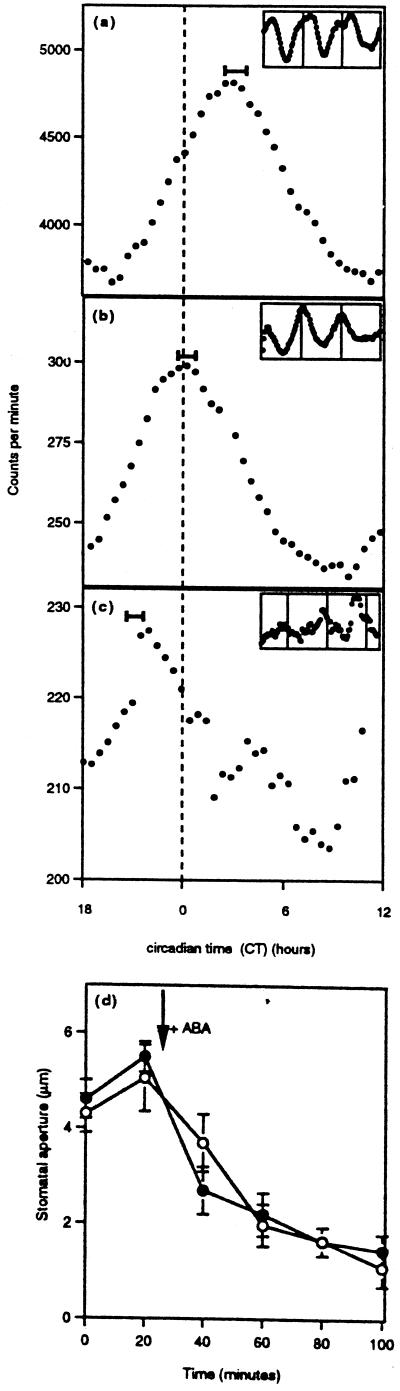
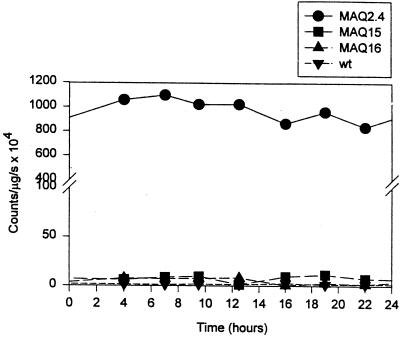
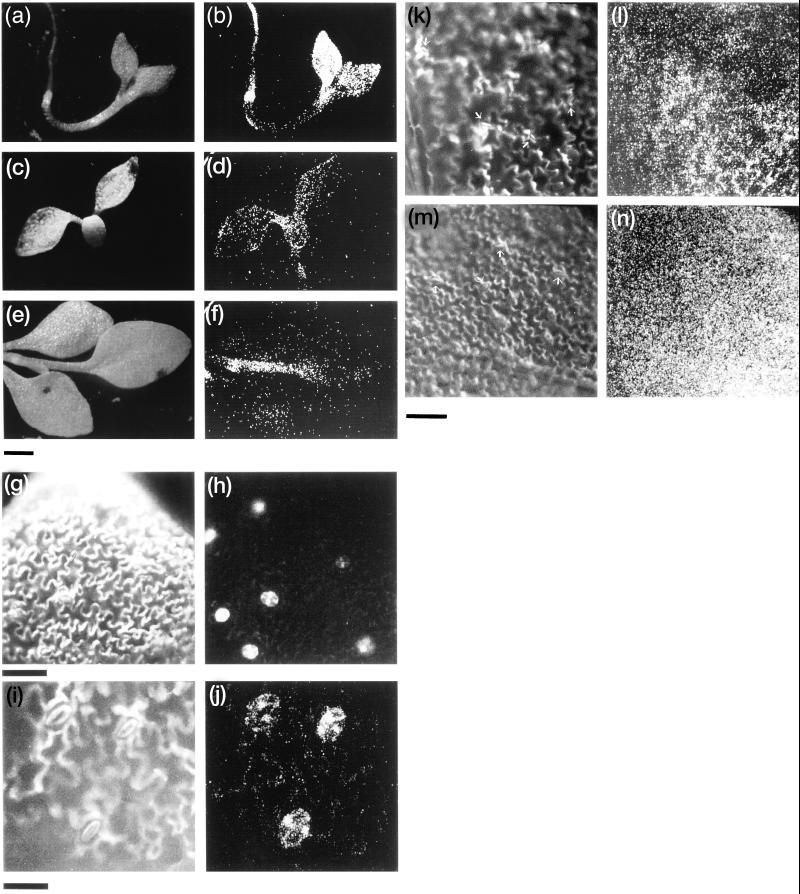
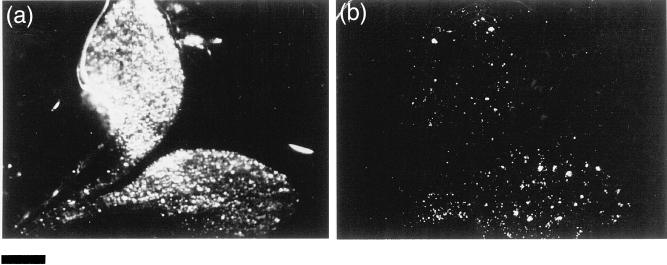
Transgenic tobacco (Nicotiana plumbaginifolia) seedlings containing the Ca(2+)-sensitive luminescent protein aequorin have been shown to exhibit circadian variations in cytosolic calcium. Concomitant measurements of cytosolic and nuclear calcium show that circadian variations in the cytoplasm are not expressed in the nucleus. To investigate whether all cells of transgenic seedlings contribute equally to circadian variations in cytosolic calcium, different promoters eliciting different expression patterns have been placed upstream of aequorin and used for transformation. The circadian peak occurred at different times in the three transgenic lines constructed. Luminescence imaging of these transgenic lines indicated that aequorin was differentially accumulated among the main tissues and cells of the seedlings and overcoat technology with applied epidermal strips indicated that the surface cell layers contribute the vast majority of luminescent light. We conclude that the Ca(2+) rhythmicities of cells and tissues oscillate with distinct differences in phase, that this might represent different underlying cellular control mechanisms and that these observations have significant implications for our understanding and study of Ca(2+) mediated signal transduction in plant cells.
Figures
Similar articles
-
Dark-stimulated calcium ion fluxes in the chloroplast stroma and cytosol.Plant Cell. 2002 Jun;14(6):1279-91. doi: 10.1105/tpc.000653. Plant Cell. 2002. PMID: 12084827 Free PMC article.
-
Circadian oscillations of cytosolic and chloroplastic free calcium in plants.Science. 1995 Sep 29;269(5232):1863-5. doi: 10.1126/science.7569925. Science. 1995. PMID: 7569925
-
Distinct calcium signaling pathways regulate calmodulin gene expression in tobacco.Plant Physiol. 1999 Nov;121(3):705-14. doi: 10.1104/pp.121.3.705. Plant Physiol. 1999. PMID: 10557218 Free PMC article.
-
The plant clock shows its metal: circadian regulation of cytosolic free Ca(2+).Trends Plant Sci. 2005 Jan;10(1):15-21. doi: 10.1016/j.tplants.2004.12.001. Trends Plant Sci. 2005. PMID: 15642519 Review.
-
Recombinant aequorin methods for intracellular calcium measurement in plants.Methods Cell Biol. 1995;49:201-16. doi: 10.1016/s0091-679x(08)61455-7. Methods Cell Biol. 1995. PMID: 8531755 Review. No abstract available.
Cited by
-
The physiology of circadian rhythms in plants.New Phytol. 2003 Nov;160(2):281-303. doi: 10.1046/j.1469-8137.2003.00895.x. New Phytol. 2003. PMID: 33832173 Review.
-
Reorientation of seedlings in the earth's gravitational field induces cytosolic calcium transients.Plant Physiol. 2002 Jun;129(2):786-96. doi: 10.1104/pp.011007. Plant Physiol. 2002. PMID: 12068119 Free PMC article.
-
The circadian clock that controls gene expression in Arabidopsis is tissue specific.Plant Physiol. 2002 Sep;130(1):102-10. doi: 10.1104/pp.005405. Plant Physiol. 2002. PMID: 12226490 Free PMC article.
-
Linking neural activity and molecular oscillations in the SCN.Nat Rev Neurosci. 2011 Sep 2;12(10):553-69. doi: 10.1038/nrn3086. Nat Rev Neurosci. 2011. PMID: 21886186 Free PMC article. Review.
-
Distinct light and clock modulation of cytosolic free Ca2+ oscillations and rhythmic CHLOROPHYLL A/B BINDING PROTEIN2 promoter activity in Arabidopsis.Plant Cell. 2007 Nov;19(11):3474-90. doi: 10.1105/tpc.106.046011. Epub 2007 Nov 2. Plant Cell. 2007. PMID: 17982000 Free PMC article.
References
-
- Allen DG, Blinks JR, Prendergast FG. Aequorin luminescence: relation of light emission to calcium concentration: a calcium-independent component. Science. 1977;195:996–998. - PubMed
-
- Anderson SL, Kay SA. Illuminating the mechanism of the circadian clock in plants. Trends Plant Sci. 1996;1:51–57.
-
- Badminton MN, Kendall JM, Rembold CM, Campbell AK. Current evidence suggests independent regulation of nuclear calcium. Cell Calcium. 1998;23:79–86. - PubMed
-
- Blinks JR, Mattingly PH, Jewell BR, van Leeuwen M, Harrer GC, Allen DG. Practical aspects of the use of aequorin as a calcium indicator: assay, preparation, microinjection and interpretation of signals. In: Deluca M, editor. Methods in Enzymology. Vol. 57. New York: Academic Press; 1978. pp. 292–328.
-
- Ermolayeva E, Hohmeyer H, Johannes E, Sanders D. Calcium dependent membrane depolarisation activated by phytochrome in the moss Physcomitrella patens. Planta. 1996;199:352–358.
Publication types
MeSH terms
Substances
Grants and funding
LinkOut - more resources
Full Text Sources
Miscellaneous
