

Colored noise and computational inference in neurophysiological (fMRI) time series analysis: resampling methods in time and wavelet domains
- PMID: 11169871
- PMCID: PMC6871881
- DOI: 10.1002/1097-0193(200102)12:2<61::aid-hbm1004>3.0.co;2-w
Colored noise and computational inference in neurophysiological (fMRI) time series analysis: resampling methods in time and wavelet domains
Abstract
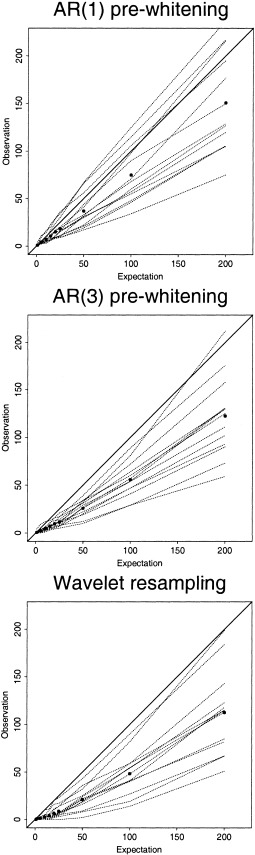
Even in the absence of an experimental effect, functional magnetic resonance imaging (fMRI) time series generally demonstrate serial dependence. This colored noise or endogenous autocorrelation typically has disproportionate spectral power at low frequencies, i.e., its spectrum is (1/f)-like. Various pre-whitening and pre-coloring strategies have been proposed to make valid inference on standardised test statistics estimated by time series regression in this context of residually autocorrelated errors. Here we introduce a new method based on random permutation after orthogonal transformation of the observed time series to the wavelet domain. This scheme exploits the general whitening or decorrelating property of the discrete wavelet transform and is implemented using a Daubechies wavelet with four vanishing moments to ensure exchangeability of wavelet coefficients within each scale of decomposition. For (1/f)-like or fractal noises, e.g., realisations of fractional Brownian motion (fBm) parameterised by Hurst exponent 0 < H < 1, this resampling algorithm exactly preserves wavelet-based estimates of the second order stochastic properties of the (possibly nonstationary) time series. Performance of the method is assessed empirically using (1/f)-like noise simulated by multiple physical relaxation processes, and experimental fMRI data. Nominal type 1 error control in brain activation mapping is demonstrated by analysis of 13 images acquired under null or resting conditions. Compared to autoregressive pre-whitening methods for computational inference, a key advantage of wavelet resampling seems to be its robustness in activation mapping of experimental fMRI data acquired at 3 Tesla field strength. We conclude that wavelet resampling may be a generally useful method for inference on naturally complex time series.
Figures
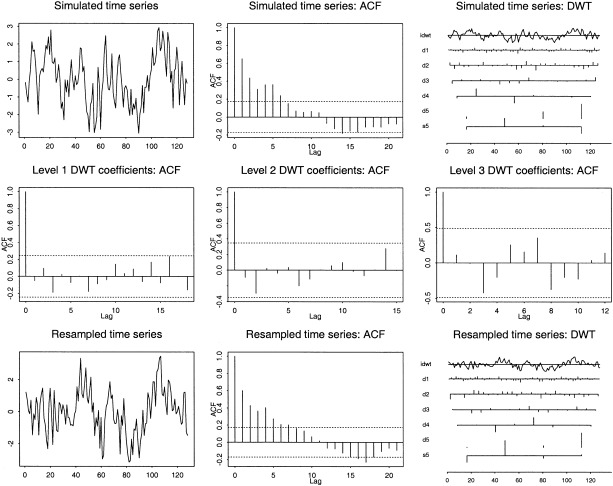
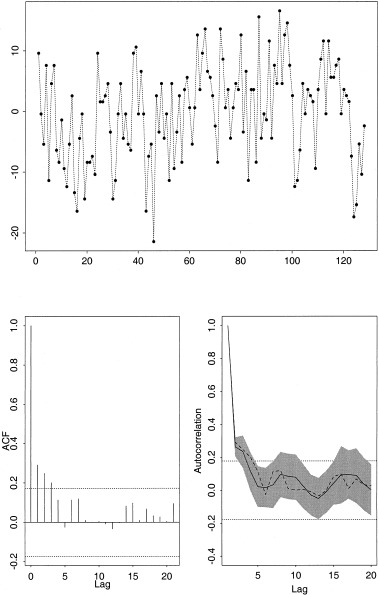
 ; and its discrete wavelet transform (DWT). The coefficients of the dilated and translated mother wavelets are shown for five levels of detail j, labelled d1–d5; and for the father wavelet, labelled s5. The top row of this panel shows the time series reconstructed by the inverse wavelet transform. Middle row, from left to right: The autocorrelation functions of the wavelet coefficients at levels d1–d3 are shown with dashed lines indicating 95% CI for zero, 0 ± 2/
 . Bottom row, right to left: The wavelet coefficients after random permutation within each level of detail; the autocorrelation function of the time series obtained by the inverse wavelet transform on the resampled coefficients; the resampled time series. The key point is that although the original time series is significantly autocorrelated, its wavelet coefficients are relatively whitened or decorrelated, and random permutation of these serially independent or exchangeable coefficients generates a resampled time series with an autocorrelation function very similar to the original.

References
-
- Abry P, Sellan F (1996): The wavelet‐based synthesis for fractional Brownian motion proposed by F. Sellan and Y. Meyer: Remarks and fast implementation. Appl Comput Harmonic Anal 3: 377–383.
-
- Aguirre GK, Zarahn E, D'Esposito M (1997): Empirical analyses of BOLD fMRI statistics II. Spatially smoothed data collected under null hypothesis and experimental conditions. NeuroImage 5: 199–212. - PubMed
-
- Box GEP, Pierce DA (1970): Distribution of residual autocorrelations in autoregressive integrated moving average time series models. J Am Stat Assoc 65: 1509–1526.
-
- Bruce A, Gao H‐Y (1996): Applied wavelet analysis with S‐PLUS. New York, NY: Springer.
Publication types
MeSH terms
Grants and funding
LinkOut - more resources
Full Text Sources
Other Literature Sources
Medical
