Comparative Study
. 2001 Feb;12(2):79-93.
doi: 10.1002/1097-0193(200102)12:2<79::aid-hbm1005>3.0.co;2-i.

Detection of fMRI activation using cortical surface mapping

Affiliations
Comparative Study

Detection of fMRI activation using cortical surface mapping

A Andrade et al. Hum Brain Mapp. 2001 Feb.

Abstract

A methodology for fMRI data analysis confined to the cortex, Cortical Surface Mapping (CSM), is presented. CSM retains the flexibility of the General Linear Model based estimation, but the procedures involved are adapted to operate on the cortical surface, while avoiding to resort to explicit flattening. The methodology is tested by means of simulations and application to a real fMRI protocol. The results are compared with those obtained with a standard, volume-oriented approach (SPM), and it is shown that CSM leads to local differences in sensitivity, with generally higher sensitivity for CSM in two of the three subjects studied. The discussion provided is focused on the benefits of the introduction of anatomical information in fMRI data analysis, and the relevance of CSM as a step toward this goal.


Figures

Figure 1
Figure 1
Match between interpolating lattice (originally extracted from anatomical image) and functional scan (for subject 1). Lattice nodes (after shift in normal direction to account for cortical thickness) are shown in a lighter shade, superimposed over coronal, sagittal, and transverse views of a T*2‐weighted functional scan. Note that apparent discontinuities in the lattice surface outline are due to the interpolation step (see text for explanation).
Figure 2
Figure 2
Left: Lattice nodes overlayed on sections of anatomical scan (for subject 1). Right: Detail of axial section. Note that apparent discontinuities in the lattice surface outline are due to the interpolation step (see text for explanation).
Figure 3
Figure 3
Expected (dashed line) vs. observed (solid line) false positive rate for simulations. 5 mm (top) and 8 mm (bottom) surface‐based equivalent smoothing kernels. Corrected thresholds range from 0.01 to 0.2.
Figure 4
Figure 4
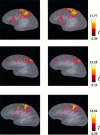
Activated (P < 0.05 corrected) regions superimposed over inflated representations of the left cortex, for the three subjects (top to bottom). Left column: CSM results. Right column: SPM results. The background is a map of curvature signs, making it possible to distinguish the contours of sulci (negative curvature, darker shade) and gyri (positive curvature, lighter shade). Blobs are semi‐transparent to avoid completely blotting out sulcal limits. The colour scale shown for each subject is the same for both modalities (CSM and SPM).
Figure 5
Figure 5
Local sensitivity ratios for the three subjects (top to bottom). Thresholds range from 1 to 1 × 10⁻¹⁰. Solid line: SPM sensitivity at CSM maxima locations (CSM vs. SPM curve). Dashed line: CSM sensitivity at SPM maxima locations (SPM vs. CSM curve). Dotted vertical line indicates the threshold corresponding to 5 × 10⁻⁶ uncorrected. (See text for explanation.)
Figure 6
Figure 6
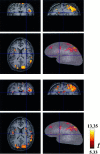
Activation (P < 0.05 corrected) superimposed over anatomical sections and inflated left cortex (subject 2). Top: SPM analysis. Bottom: CSM analysis. Left insular region showing marked differences in activation between both methods is highlighted (crosshair position). The colour scale shown corresponds to the activations overlayed on the inflated cortex.
Figure 7
Figure 7
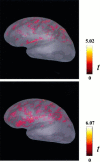
Difference (CSM − SPM) t images over inflated cortex (left hemisphere), for subject 2. Top: Positive values of difference map (CSM sensitivity greater than SPM sensitivity). Bottom: Negative values of difference map (SPM sensitivity greater than CSM sensitivity). In both cases, higher values of colour scale correspond to larger differences between methods. Background is a cortical depth binary map: regions deeper than a given threshold (corresponding roughly to the average cortical depth) are shown in a lighter shade.

References

    1. Carman GJ, Drury HA, Van Essen DC (1995): Computational methods for constructing and unfolding the cortex. Cerebral Cortex 5: 506–517. - PubMed
    1. Coulon O, Bloch I, Frouin V, Mangin J‐F (1997): Multiscale measures in linear scale‐space for characterizing cerebral functional activations in 3D PET difference images. Lecture Notes Comput Sci 1252: 188–199.
    1. DeYoe EA, Carman GJ, Bandettini P, Glickman S, Wieser J, Cox R, Miller D, Neitz J (1996): Mapping striate and extrastriate visual areas in human cerebral cortex. Proc Nat Acad Sci USA 93: 2382–2386. - PMC - PubMed
    1. Drury HA, Van Essen DC, Anderson CH, Lee CW, Coogan TA, Lewis JW (1996): Computerized mappings of the cerebral cortex: A multiresolution flattening method and a surface‐based coordinate system. J Cogn Neurosci 8: 1–28. - PubMed
    1. Fischl B, Sereno MI, Tootell RBH, Dale AM (1999): High‐resolution intersubject averaging and a coordinate system for the cortical surface. Hum Brain Mapp 8: 272–284. - PMC - PubMed

Publication types