. 2001 Mar;12(3):168-79.
doi: 10.1002/1097-0193(200103)12:3<168::aid-hbm1013>3.0.co;2-o.

Mapping of early and late human somatosensory evoked brain potentials to phasic galvanic painful stimulation

Affiliations

Mapping of early and late human somatosensory evoked brain potentials to phasic galvanic painful stimulation

C Babiloni et al. Hum Brain Mapp. 2001 Mar.

Abstract

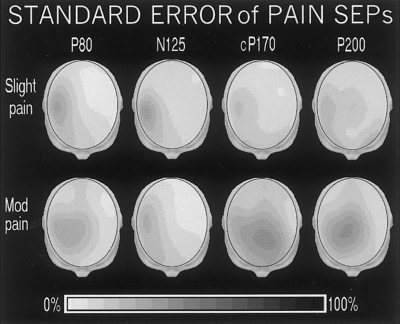
In the present study, we modeled the spatiotemporal evolution of human somatosensory evoked cortical potentials (SEPs) to brief median-nerve galvanic painful stimulation. SEPs were recorded (-50 to +250 ms) from 12 healthy subjects following nonpainful (reference), slight painful, and moderate painful stimulations (subjective scale). Laplacian transformation of scalp SEPs reduced head volume conduction effects and annulled electric reference influence. Typical SEP components to the galvanic nonpainful stimulation were contralateral frontal P20-N30-N60-N120-P170, central P22-P40, and parietal N20-P30-P60-P120 (N = negativity, P = positivity, number = latency in ms). These components were observed also with the painful stimulations, the N60, N120, P170 having a longer latency with the painful than nonpainful stimulations. Additional SEP components elicited by the painful stimulations were parietomedian P80 as well as central N125, P170 (cP170), and P200. These additional SEP components included the typical vertex negative-positive complex following transient painful stimulations. Latency of the SEP components exclusively elicited by painful stimulation is highly compatible with the involvement of A delta myelinated fibers/spinothalamic pathway. The topography of these components is in line with the response of both nociceptive medial and lateral systems including bilateral primary sensorimotor and anterior cingulate cortical areas. The role of attentive, affective, and motor aspects in the modulation of the reported SEP components merits investigation in future experiments.


Figures

Figure 1
Figure 1
Reliability of centromedian (Cz, 10–20 system) waveforms of spatially enhanced somatosensory evoked potentials (SEPs) to galvanic painful stimulation in a representative subject. Stimulations consisted of a brief galvanic shocks delivered at the left wrist in correspondence with median nerve locations. Experimental design included three levels of painful stimulation intensity (nonpainful, slight painful, and moderate painful levels), according to a subjective scale. The centromedian SEP waveforms are shown averaging trials of the first (1–300 trials) and second (301–600 trials) halves of the experimental painful conditions. As a reference, the subtraction waveform of centromedian SEPs to the moderate painful minus nonpainful stimulation is also shown.
Figure 2
Figure 2
Most representative waveforms of spatially enhanced SEPs to the nonpainful (thin traces) and moderate painful (thick traces) stimulations in the representative subject.
Figure 3
Figure 3
Across‐subjects amplitude color maps of the spatially enhanced SEP components to nonpainful stimulation (P20‐N20, P22, N30‐P30, P40, N60, N120, and P170). As a reference, the maps of corresponding SEPs to the slight and moderate painful stimulations are also shown. The maps were calculated on a 3D “quasi‐realistic” head model by a spline interpolating function. This model was constructed based on the magnetic resonance data of 152 subjects digitized at Brain Imaging Neurologic Institute of Montreal (SPM96). Color scale: for each map, maximum negativity (‐) and positivity (+) values (μV/cm2) are coded in white and violet, respectively. The actual maximum negative (‐) and positive (+) values (μV/cm2) of each SEP component are reported under the corresponding color map.
Figure 4
Figure 4
Across‐subjects amplitude color maps of the spatially enhanced specific SEP components to the slight and moderate painful stimulations (P80, N125, cP170, P200). As a reference, the maps of SEPs to nonpainful stimulation are also shown at corresponding latencies. Color scale: for each map, maximum negativity (‐) and positivity (+) values (μV/cm2) are coded in white and violet, respectively. The actual maximum negative (‐) and positive (+) values (μV/cm2) of each SEP component is reported under the corresponding color map.
Figure 5
Figure 5
Standard error gray maps of the spatially enhanced standard pain‐induced (P80, N125, cP170, P200) SEP components. For each map, the color black coded standard error values equal to across‐subjects mean values (100%) reported in the maps of Figure 4.
Figure 6
Figure 6
T‐testing color maps of the spatially enhanced SEP components to the painful stimulations (P80, N125, cP170, P200). Such an explorative statistical comparison regarded amplitude of SEPs to the nonpainful vs. moderate painful conditions as well as to the slight vs. moderate painful conditions. Color scale: maximum negative (‐) and positive (+) t values are coded in white and violet, respectively. Both negative (‐) and positive (+) t values indicate increased amplitude of the SEPs to the moderate painful stimulation with respect to the nonpainful (first row) and slight painful (second row) stimulations. The actual maximum negative (‐) and positive (+) t values of each SEP component are reported under the corresponding color map.

Similar articles

Cited by

References

    1. Allison T, McCarthy C, Wood S, Jones J (1991): Potentials evoked in human and monkey cerebral cortex by stimulation of the median nerve. A review of scalp and intracranial recordings. Brain 114: 2465–2503. - PubMed
    1. Arendt‐Nielsen L (1994): Characteristics, detection, and modulation of laser‐evoked vertex potentials. Acta Anaesthesiol Scand Suppl 101: 7–44. - PubMed
    1. Arendt‐Nielsen L, Yamasaki H, Nielsen J, Naka D, Kakigi R (1999): Magnetoencephalographic responses to painful impact stimulation. Brain Res 839: 203–208. - PubMed
    1. Babiloni F, Babiloni C, Carducci F, Fattorini L, Onorati P, Urbano A (1996): Spline Laplacian estimate of EEG potentials over a realistic magnetic resonance‐constructed scalp surface model. Electroencephalogr Clin Neurophysiol 98: 363–373. - PubMed
    1. Babiloni F, Carducci F, Babiloni C, Urbano A (1998): Improved realistic Laplacian estimate of highly‐sampled EEG potentials by regularization techniques. Electroencephalogr Clin Neurophysiol 106: 336–343. - PubMed