. 2001 Feb 13;98(4):1555-9.
doi: 10.1073/pnas.98.4.1555. Epub 2001 Jan 30.

Electrophysiological characterization of specific interactions between bacterial sensory rhodopsins and their transducers

Affiliations

Electrophysiological characterization of specific interactions between bacterial sensory rhodopsins and their transducers

G Schmies et al. Proc Natl Acad Sci U S A. .

Abstract

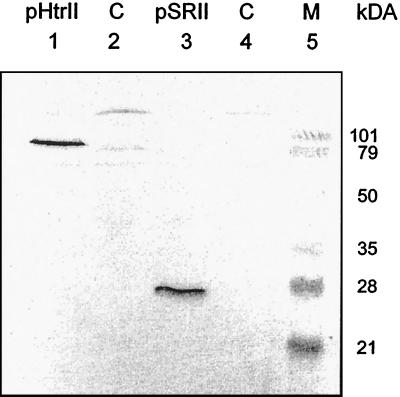
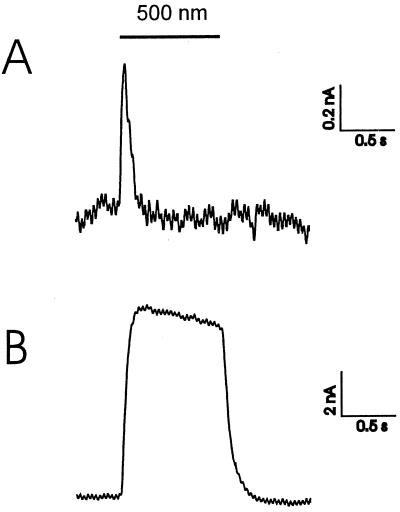
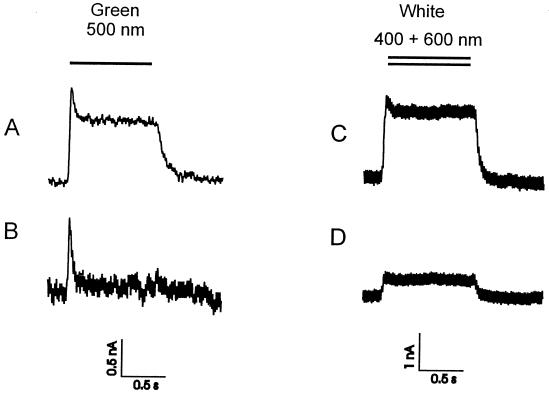
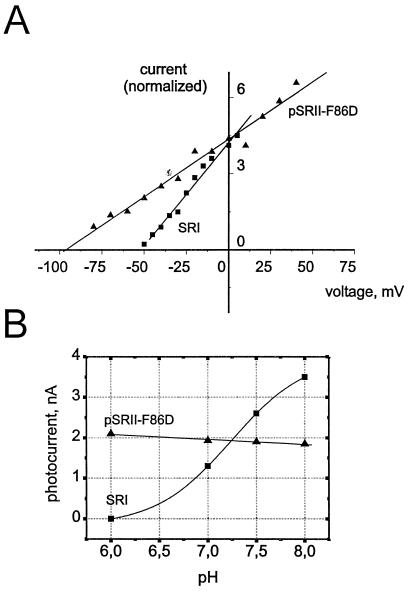
The halobacterial phototaxis receptors sensory rhodopsin I and II (SRI, SRII) enable the bacteria to seek optimal light conditions for ion pumping by bacteriorhodopsin and/or halorhodopsin. The incoming signal is transferred across the plasma membrane by means of receptor-specific transducer proteins that bind tightly to their corresponding photoreceptors. To investigate the receptor/transducer interaction, advantage is taken of the observation that both SRI and SRII can function as proton pumps. SRI from Halobacterium salinarum, which triggers the positive phototaxis, the photophobic receptor SRII from Natronobacterium pharaonis (pSRII), as well as the mutant pSRII-F86D were expressed in Xenopus oocytes. Voltage-clamp studies confirm that SRI and pSRII function as light-driven, outwardly directed proton pumps with a much stronger voltage dependence than the ion pumps bacteriorhodopsin and halorhodopsin. Coexpression of SRI and pSRII-F86D with their corresponding transducers suppresses the proton transport, revealing a tight binding and specific interaction of the two proteins. These latter results may be exploited to further analyze the binding interaction of the photoreceptors with their downstream effectors.


Figures

Figure 1
Figure 1
Western blot of oocyte plasma membranes. Membranes of 50 oocytes, independently injected with either pSRIImRNA or pHtrIImRNA, have been isolated by subsequent centrifugation over a sucrose and nycodenz density gradient. The blotted membranes have been incubated with an antibody (Qiagen, Hilden, Germany) against the C-terminal 6× histidine-tag of the proteins. The two prominent bands in lanes 1 and 3 at ≈85 kDa and ≈25 kDa can be assigned to pHtrII and pSRII, respectively. Lanes 2 and 4 show control membranes of not injected oocytes.
Figure 2
Figure 2
Voltage–clamp signals of pSRII at −40 mV (50 Hz filtering). (A) The photocurrent of pSRII at pH 7.6 (90 mM NaCl, 5 mM BaCl, 20 mM TEA⋅Cl, 10 mM Mops), whereas the lower trace given in B was recorded with the same oocyte at pH 5.6 and the presence of 50 mM sodiumazide (40 mM NaCl, 5 mM BaCl, 20 mM TEA⋅Cl, 10 mM Mes).
Figure 3
Figure 3
Photocurrent of pSRII-F86D (A and B) and SRI (C and D) in the absence (A and C) and presence of their corresponding transducers pHtrII and pHtrI (B and D). The voltage–clamp signals have been recorded 4 days after the injection of the SR's mRNA as well as the SR's/Htr's mRNA at a membrane potential of −20 mV (20 Hz filtering) for SRI and SRI/HtrI and −40 mV (50 Hz filtering) for pSRII-F86D and pSRII-F86D/pHtrII. The bath solution consisted of 90 mM NaCl, 5 mM BaCl, 20 mM TEA⋅Cl, 10 mM Mops, pH 7.6.
Figure 4
Figure 4
Voltage- (A) and pH-dependence (B) of the SRI and pSRII-F86D photocurrents. Triangles represent data points of pSRII-F86D (normalized to SRI current at 0 mV), squares are indicative for SRI. Both pigments show a steep linear current/voltage-dependence and the signals do not invert at any observed potential (A). The pH-dependence (B) was recorded at a constant membrane potential of −20 mV (SRI) or −40 mV (pSRII-F86D). In the case of pSRII-F86D, only a slight linear increase of the photocurrent with increasing proton concentration is visible, whereas SRI shows a sigmoidal pH dependence. The deflection point corresponds to the pKa 7.2 (Boltzmann fit; Imin = −0.16 ± 0.2, Imax = 4.0 ± 0.3, pH (Imax/2) = 7.2 ± 0.1).

References

    1. Nagel G, Möckel B, Büldt G, Bamberg E. FEBS Lett. 1995;377:263–266. - PubMed
    1. Nagel G, Kelety B, Möckel B, Büldt G, Bamberg E. Biophys J. 1998;74:403–412. - PMC - PubMed
    1. Spudich J L. Mol Microbiol. 1998;28:1051–1058. - PubMed
    1. Marwan W, Oesterhelt D. Am Soc Microbiol News. 2000;66:83–89.
    1. Olson K D, Spudich J L. Biophys J. 1993;65:2578–2585. - PMC - PubMed

Publication types

MeSH terms

LinkOut - more resources