. 2001 Feb 13;98(4):1577-82.
doi: 10.1073/pnas.98.4.1577. Epub 2001 Feb 6.

Real-time visualization of intracellular hydrodynamics in single living cells

Affiliations

Real-time visualization of intracellular hydrodynamics in single living cells

E Potma et al. Proc Natl Acad Sci U S A. .

Abstract

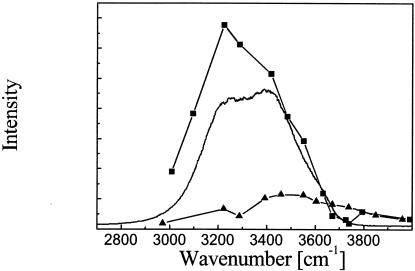
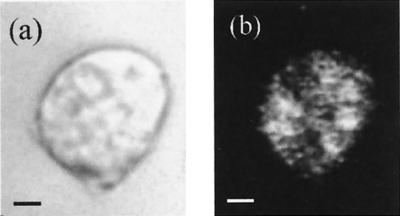
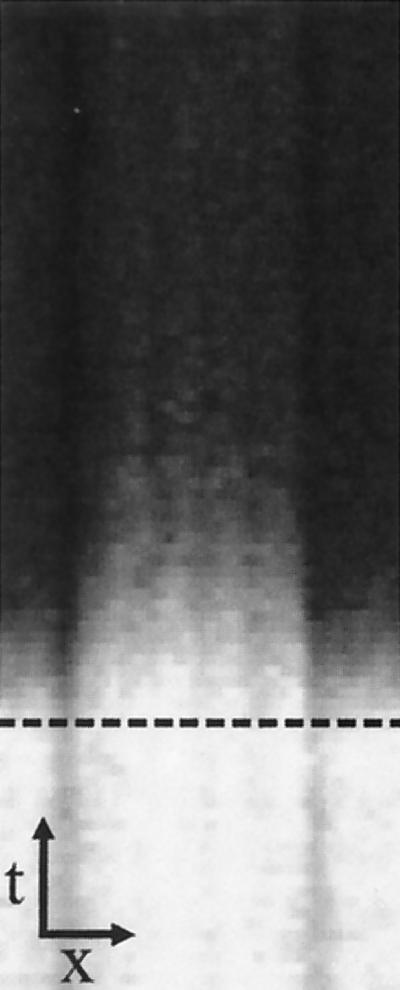
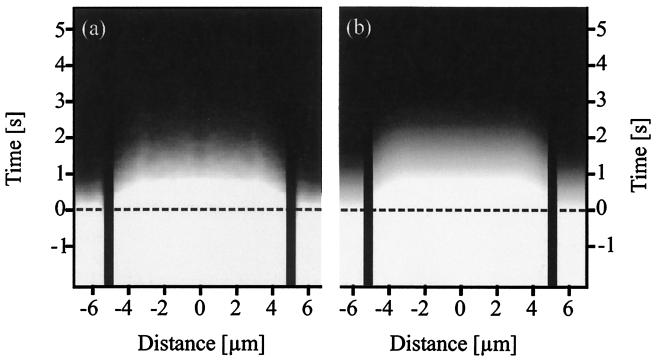
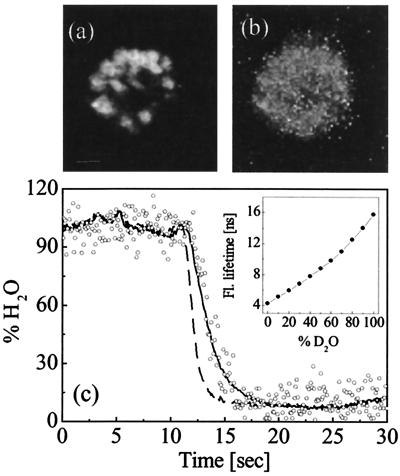
Intracellular water concentrations in single living cells were visualized by nonlinear coherent anti-Stokes Raman scattering (CARS) microscopy. In combination with isotopic exchange measurements, CARS microscopy allowed the real-time observation of transient intracellular hydrodynamics at a high spatial resolution. Studies of the hydrodynamics in the microorganism Dictyostelium discoideum indicated the presence of a microscopic region near the plasma membrane where the mobility of water molecules is severely restricted. Modeling the transient hydrodynamics eventuated in the determination of cell-specific cytosolic diffusion and plasma membrane permeability constants. Our experiments demonstrate that CARS microscopy offers an invaluable tool for probing single-cell water dynamics.


Figures

Figure 1
Figure 1
Vibrational spectra in the region of the O—H stretch vibration of water. Squares correspond to CARS spectrum of distilled water, whereas triangles refer to the CARS response from D2O. The solid line represents the spontaneous Raman band profile.
Figure 2
Figure 2
Coherent anti-Stokes Raman scattering microscopy of D. discoideum. (a) CARS image of a single dictyostelium cell in aqueous medium. Pump laser was tuned to 636 nm, and Stokes beam was set to 800 nm to address the O—H-stretch vibration of water. The image is recorded in 5 s and consists of 16 averages per pixel. (Bar = 2 μm.) (b) Autofluorescence image measured simultaneously with a.
Figure 3
Figure 3
Spatiotemporal CARS recording of a single cell that is initially immersed in aqueous medium and subsequently flushed with isotonic D2O medium. The dashed line indicates the moment at which the perfusion chamber is flushed. Shaded horizontal lines correspond to the position of the plasma membrane. Arrows, 3 μm (horizontal, x), 1.5 s (vertical, t).
Figure 4
Figure 4
Comparison between experimental traces and simulation. (a) Experimentally determined water concentration profile in a single D. discoideum cell. Medium exchange starts at t = 0, indicated by dashed line. Vertical black lines mark the positions of the plasma membrane. Figure was corrected for variations in signal because of scattering at membranes and intracellular structures. The image is composed from the average of 24 individual measurements by correlative image analysis; the x axis is scaled proportional to the average cell diameter. (b) Simulation based on the model of a spatially dependent diffusion coefficient. The region of restricted water diffusion adjacent to the plasma membrane is set to 20% of the cell diameter. A diffusion constant of Dw = 5 μm2/s was used in the simulation for the zone of restricted water diffusion; outside this region, the diffusion was assumed to be water-like (Dw > 500 μm2/s). The membrane permeability was found to be Pd = 2.2 μm/s.
Figure 5
Figure 5
Analysis of plasma membrane permeability as determined from water efflux measurements. Distribution of membrane permeability constants of AX3 D. discoideum cells (gray bars) and of aquaporin-transformed act15∷rd28 cells (black bars).
Figure 6
Figure 6
TPE fluorescence of D. discoideum that have been labeled with ANTS. (a) TPE fluorescence intensity image. Fluorescent probe is accumulated in cytosolic vesicles. (Bar = 2 μm.) (b) Fluorescence lifetime image of the same cell. Average lifetime is determined to be 4.5 ns, corresponding to an aqueous environment. (c) Simultaneous measurement of total intracellular CARS signal (solid line) and lifetime change of the ANTS fluorophore (dots) during a flushing event. Dashed line indicates the response time of the perfusion chamber. Inset shows the change in TPE fluorescence lifetime of a 10 mM ANTS solution for different volume fractions of D2O relative to H2O.

References

    1. Lodish H, Berk A, Lawrence Zipursky S, Matsudaira P, Baltimore D, Darnell J E. Molecular Cell Biology. New York: Freeman; 1999.
    1. Finkelstein A. Water Movement Through Lipid Bilayers, Pores and Membranes. New York: Wiley; 1987.
    1. Crick F. Nature (London) 1970;225:420–422. - PubMed
    1. Huster D, Jin A J, Arnold K, Gawrisch K. Biophys J. 1997;73:855–864. - PMC - PubMed
    1. Reginald Waldeck A, Hossein Nouri-Sorkhabi M, Sullivan D R, Huchel P W. Biophys Chem. 1995;55:197–208. - PubMed

LinkOut - more resources