

From cell death to embryo arrest: mathematical models of human preimplantation embryo development
- PMID: 11172006
- PMCID: PMC29312
- DOI: 10.1073/pnas.98.4.1655
From cell death to embryo arrest: mathematical models of human preimplantation embryo development
Abstract
Human preimplantation embryos exhibit high levels of apoptotic cells and high rates of developmental arrest during the first week in vitro. The relation between the two is unclear and difficult to determine by conventional experimental approaches, partly because of limited numbers of embryos. We apply a mixture of experiment and mathematical modeling to show that observed levels of cell death can be reconciled with the high levels of embryo arrest seen in the human only if the developmental competence of embryos is already established at the zygote stage, and environmental factors merely modulate this. This suggests that research on improving in vitro fertilization success rates should move from its current concentration on optimizing culture media to focus more on the generation of a healthy zygote and on understanding the mechanisms that cause chromosomal and other abnormalities during early cleavage stages.
Figures
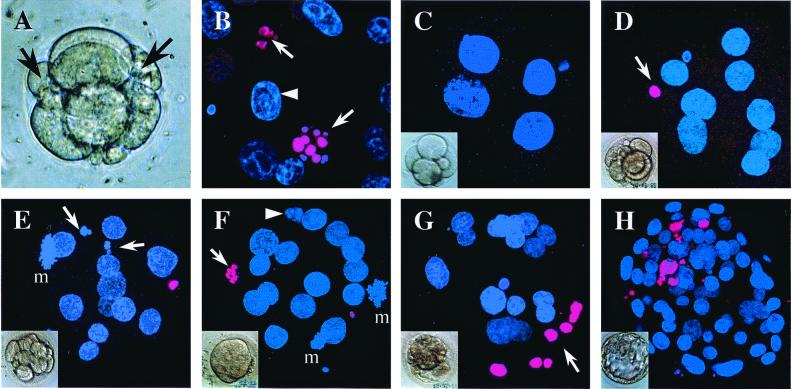
 ) and healthy
interphase nucleus (▸). (C) Day 2 4-cell embryo.
(D) Day 4 8-cell embryo with TUNEL-labeled polar body
().
(E) Day 4 embryo with 13 cells and 15 nuclei, including
2 fragmenting
() and one in
mitosis (m). Note TUNEL-labeled polar body. (F) Day 4
morula with 18 nuclei, including 2 in mitosis (m); 1 fragmented nucleus
that is TUNEL-labeled
() and 1
fragmented nucleus with no TUNEL labeling (▸). (G) Day
4 morula with 24 nuclei, including 7 condensed, TUNEL-labeled nuclei
(). (H) Day 6
blastocyst with 87 nuclei, 12 of which are TUNEL-labeled and mostly
localized to the region of the inner cell mass.
) and healthy
interphase nucleus (▸). (C) Day 2 4-cell embryo.
(D) Day 4 8-cell embryo with TUNEL-labeled polar body
().
(E) Day 4 embryo with 13 cells and 15 nuclei, including
2 fragmenting
() and one in
mitosis (m). Note TUNEL-labeled polar body. (F) Day 4
morula with 18 nuclei, including 2 in mitosis (m); 1 fragmented nucleus
that is TUNEL-labeled
() and 1
fragmented nucleus with no TUNEL labeling (▸). (G) Day
4 morula with 24 nuclei, including 7 condensed, TUNEL-labeled nuclei
(). (H) Day 6
blastocyst with 87 nuclei, 12 of which are TUNEL-labeled and mostly
localized to the region of the inner cell mass.
Similar articles
-
Mitotic spindle disruption in human preimplantation embryos activates the spindle assembly checkpoint but not apoptosis until Day 5 of development.Mol Hum Reprod. 2017 May 1;23(5):321-329. doi: 10.1093/molehr/gax007. Mol Hum Reprod. 2017. PMID: 28159965
-
Paternal influence of sperm DNA integrity on early embryonic development.Hum Reprod. 2014 Nov;29(11):2402-12. doi: 10.1093/humrep/deu228. Epub 2014 Sep 8. Hum Reprod. 2014. PMID: 25205757
-
Porcine embryo development and fragmentation and their relation to apoptotic markers: a cinematographic and confocal laser scanning microscopic study.Reproduction. 2005 Apr;129(4):443-52. doi: 10.1530/rep.1.00533. Reproduction. 2005. PMID: 15798019
-
Apoptosis in preimplantation mammalian embryo and genetics.Ital J Anat Embryol. 2001;106(2 Suppl 2):101-8. Ital J Anat Embryol. 2001. PMID: 11732565 Review.
-
Involvement of programmed cell death in preimplantation embryo demise.Hum Reprod Update. 1995 Nov;1(6):558-66. doi: 10.1093/humupd/1.6.558. Hum Reprod Update. 1995. PMID: 9079396 Review.
Cited by
-
Effect of C-type natriuretic peptide pretreatment on in vitro bovine oocyte maturation.In Vitro Cell Dev Biol Anim. 2017 Mar;53(3):199-206. doi: 10.1007/s11626-016-0101-6. Epub 2016 Oct 19. In Vitro Cell Dev Biol Anim. 2017. PMID: 27761784
-
Insights into embryonic chromosomal instability: mechanisms of DNA elimination during mammalian preimplantation development.Front Cell Dev Biol. 2024 Feb 5;12:1344092. doi: 10.3389/fcell.2024.1344092. eCollection 2024. Front Cell Dev Biol. 2024. PMID: 38374891 Free PMC article. Review.
-
Global, Survival, and Apoptotic Transcriptome during Mouse and Human Early Embryonic Development.Biomed Res Int. 2018 Nov 1;2018:5895628. doi: 10.1155/2018/5895628. eCollection 2018. Biomed Res Int. 2018. PMID: 30515407 Free PMC article.
-
A potential use of embryonic stem cell medium for the in vitro culture of preimplantation embryos.J Assist Reprod Genet. 2011 Aug;28(8):659-68. doi: 10.1007/s10815-011-9587-8. Epub 2011 May 27. J Assist Reprod Genet. 2011. PMID: 21617931 Free PMC article.
-
Effect of potential role of p53 on embryo development arrest induced by H2O2 in mouse.In Vitro Cell Dev Biol Anim. 2017 Apr;53(4):344-353. doi: 10.1007/s11626-016-0122-1. Epub 2017 Jan 27. In Vitro Cell Dev Biol Anim. 2017. PMID: 28127704
References
-
- Dawson K, Conaghan J, Ostera G, Winston R, Hardy K. Hum Reprod. 1995;10:177–182. - PubMed
-
- Human Fertilization and Embryology Authority. Human Fertilization and Embryology Authority Sixth Annual Report. London: Human Fert. Embryol. Auth.; 1997.
-
- Hardy K. Rev Reprod. 1999;4:125–134. - PubMed
-
- Hardy K. In: Preimplantation Embryo Development. Bavister B, editor. New York: Springer; 1993. pp. 184–199.
-
- Munné S, Alikani M, Tomkin G, Grifo J, Cohen J. Fertil Steril. 1995;64:382–391. - PubMed
MeSH terms
LinkOut - more resources
Full Text Sources
Other Literature Sources
