

Neuroimaging evidence implicating cerebellum in the experience of hypercapnia and hunger for air
- PMID: 11172072
- PMCID: PMC29378
- DOI: 10.1073/pnas.98.4.2041
Neuroimaging evidence implicating cerebellum in the experience of hypercapnia and hunger for air
Abstract
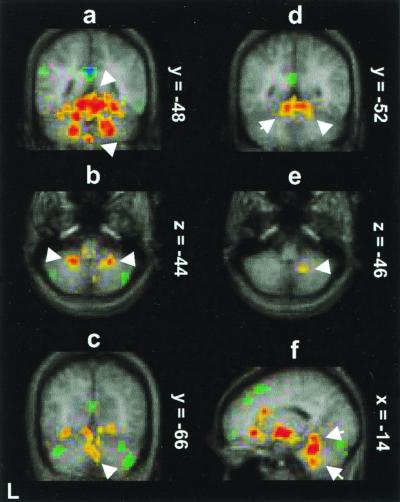
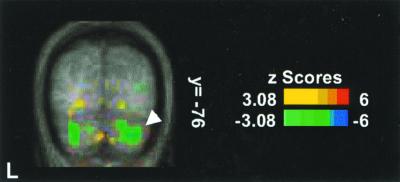
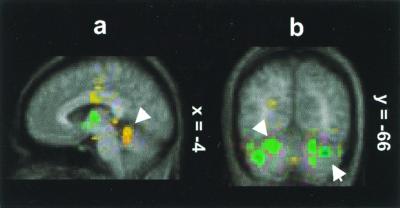
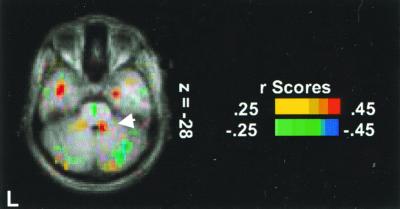
Recent neuroimaging and neurological data implicate cerebellum in nonmotor sensory, cognitive, vegetative, and affective functions. The present study assessed cerebellar responses when the urge to breathe is stimulated by inhaled CO(2). Ventilation changes follow arterial blood partial pressure CO(2) changes sensed by the medullary ventral respiratory group (VRG) and hypothalamus, entraining changes in midbrain, pons, thalamus, limbic, paralimbic, and insular regions. Nearly all these areas are known to connect anatomically with the cerebellum. Using positron emission tomography, we measured regional brain blood flow during acute CO(2)-induced breathlessness in humans. Separable physiological and subjective effects (air hunger) were assessed by comparisons with various respiratory control conditions. The conjoint physiological effects of hypercapnia and the consequent air hunger produced strong bilateral, near-midline activations of the cerebellum in anterior quadrangular, central, and lingula lobules, and in many areas of posterior quadrangular, tonsil, biventer, declive, and inferior semilunar lobules. The primal emotion of air hunger, dissociated from hypercapnia, activated midline regions of the central lobule. The distributed activity across the cerebellum is similar to that for thirst, hunger, and their satiation. Four possible interpretations of cerebellar function(s) here are that: it subserves implicit intentions to access air; it provides predictive internal models about the consequences of CO(2) inhalation; it modulates emotional responses; and that while some cerebellar regions monitor sensory acquisition in the VRG (CO(2) concentration), others influence VRG to adjust respiratory rate to optimize partial pressure CO(2), and others still monitor and optimize the acquisition of other sensory data in service of air hunger aroused vigilance.
Figures
References
-
- Holmes G. Brain. 1939;62:1–30.
-
- Thach W T, Goodkin H P, Keating J G. Annu Rev Neurosci. 1992;15:403–442. - PubMed
-
- Houk J C, Wise S P. Cereb Cortex. 1995;5:95–110. - PubMed
-
- Welsh J P, Lang E J, Sugihara I, Llinas R. Nature (London) 1995;374:453–457. - PubMed
-
- Bower J M. In: Progress in Brain Research. de Zeeuw C I, Strata P, Voogd J, editors. New York: Elsevier; 1997. pp. 483–516.
Publication types
MeSH terms
Grants and funding
LinkOut - more resources
Full Text Sources
