. 2001 Feb 13;98(4):2083-8.
doi: 10.1073/pnas.98.4.2083.

Sleep modifies retinal ganglion cell responses in the normal rat

Affiliations

Sleep modifies retinal ganglion cell responses in the normal rat

R Galambos et al. Proc Natl Acad Sci U S A. .

Abstract

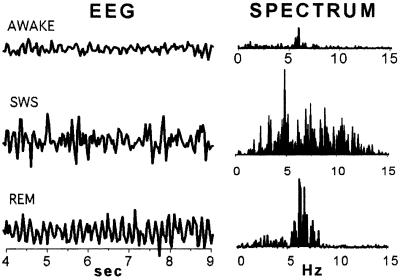
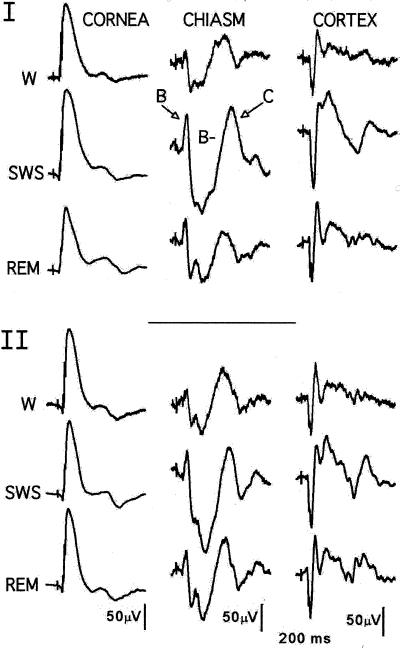
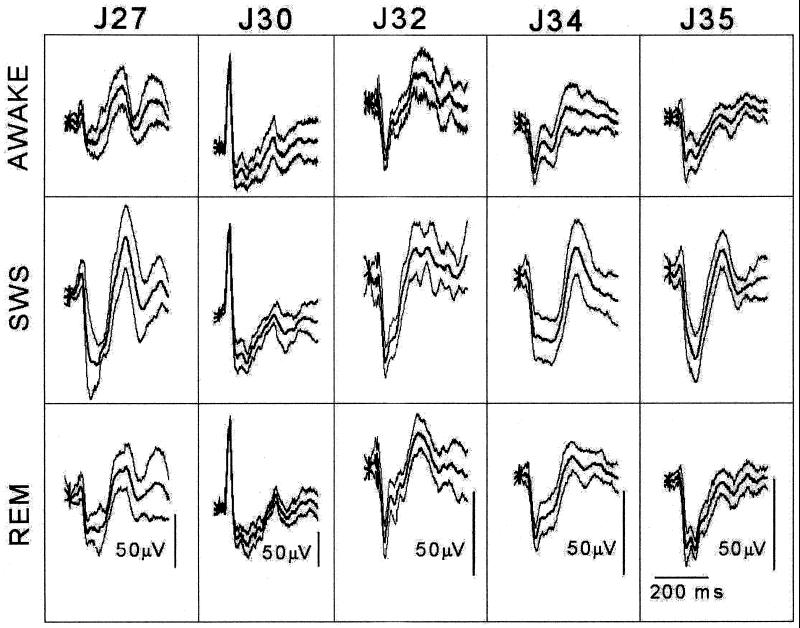
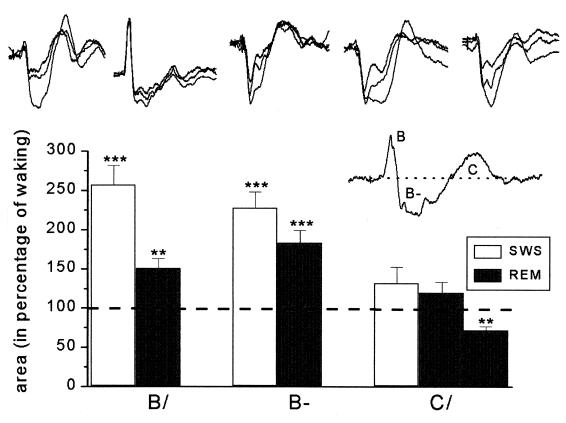
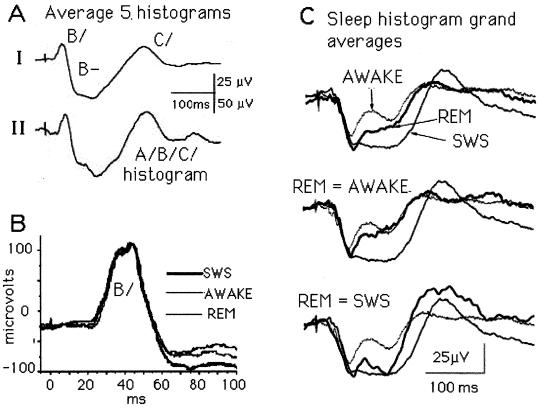
Recordings were obtained from the visual system of rats as they cycled normally between waking (W), slow-wave sleep (SWS), and rapid eye movement (REM) sleep. Responses to flashes delivered by a light-emitting diode attached permanently to the skull were recorded through electrodes implanted on the cornea, in the chiasm, and on the cortex. The chiasm response reveals the temporal order in which the activated ganglion cell population exits the eyeball; as reported, this triphasic event is invariably short in latency (5--10 ms) and around 300 ms in duration, called the histogram. Here we describe the differences in the histograms recorded during W, SWS, and REM. SWS histograms are always larger than W histograms, and an REM histogram can resemble either. In other words, the optic nerve response to a given stimulus is labile; its configuration depends on whether the rat is asleep or awake. We link this physiological information with the anatomical fact that the brain dorsal raphe region, which is known to have a sleep regulatory role, sends fibers to the rat retina and receives fibers from it. At the cortical electrode, the visual cortical response amplitudes also vary, being largest during SWS. This well known phenomenon often is explained by changes taking place at the thalamic level. However, in the rat, the labile cortical response covaries with the labile optic nerve response, which suggests the cortical response enhancement during SWS is determined more by what happens in the retina than by what happens in the thalamus.


Figures

Figure 1
Figure 1
Electrophysiological definition of rat sleep states. Typical EEG samples taken from a rat W, in SWS, and during REM (left), and the EEG power spectra of such samples (right). During online averaging, flashes were delivered manually only when the EEG pattern was seen to be consistent with one of these three brain states. In experiments where single responses were collected, the moment of stimulus delivery was marked on the EEG record, and each response was later classified as W, SWS, or REM when the EEG trace was examined.
Figure 2
Figure 2
Simultaneous retinal, optic tract, and visual cortical responses evoked during W and two stages of sleep. Stimuli (n = 50 or more) were 1-ms red flashes delivered through an LED attached to the skull. Data shown are replications 17 days apart on rat J25.
Figure 3
Figure 3
Sleep/W data collected from five rats for statistical analysis. Each column shows, for one rat, the mean ± SD of the W, SWS, and REM histograms.
Figure 4
Figure 4
Results of the statistical analysis. In the top row the W, REM, and SWS mean histograms for each rat in Fig. 3 are overlapped (in every case, the REM response lies between the W and SWS responses). (Inset) The three areas (B/, B−, and C/) that were measured and compared. The bar graphs give the percent difference between the sleep and W areas. During sleep, the increases in both the B/and B− areas of the histogram are highly significant for all animals.
Figure 5
Figure 5
Three examples of histogram variability. (A) The influence of the chiasm electrode location. Whereas none of the five SWS histograms in Fig. 3 looks like the “typical” triphasic A/B/C/histogram seen in Fig. 2, the grand average of the five histograms does. Explanation: at the electrode location where Fig. 2 was recorded, all of the axon types that leave the retina were sampled. Although this was not true at any of the five single sites, their grand average response indicates all of the fiber types were indeed sampled. (B) Some ganglion cells escape the 5-HT influences. At this electrode location, the statistically highly significant B/and early B− enhancements validated in Fig. 4 do not appear. Evidently, the ganglion cell population sampled by this electrode escaped the sleep-related changes under way elsewhere during the first poststimulus 60 ms. (C) REM histograms are variable. The three REM waveshapes (the heavy lines) are always located between the W and SWS waveforms, but one is near the W, another near the SWS, and the third lies between the two. This REM variability is unexplained.

Similar articles

Cited by

References

    1. Galambos R, Szabó-Salfay O, Barabás P, Pálhalmi J, Szilágyi N, Juhász G. Proc Natl Acad Sci USA. 2000;97:13454–13459. . (First Published November 14, 2000; 10.1073/pnas.240448697) - PMC - PubMed
    1. Galambos R, Juhász G, Kékesi A K, Nyitrai G, Szilágyi N. Proc Natl Acad Sci USA. 1994;91:5153–5157. - PMC - PubMed
    1. Gottesmann C. Neurosci Biobehav Rev. 1992;16:31–38. - PubMed
    1. Paxinos G. The Rat Nervous System. 2nd Ed. San Diego: Academic; 1995. p. xvii. , 1136.
    1. Yonemura D, Tsuchida Y. Jpn J Physiol. 1968;18:703–722. - PubMed

Publication types

LinkOut - more resources