

Analysis of prolactin-modulated gene expression profiles during the Nb2 cell cycle using differential screening techniques
- PMID: 11178248
- PMCID: PMC15026
- DOI: 10.1186/gb-2000-1-4-research0008
Analysis of prolactin-modulated gene expression profiles during the Nb2 cell cycle using differential screening techniques
Abstract
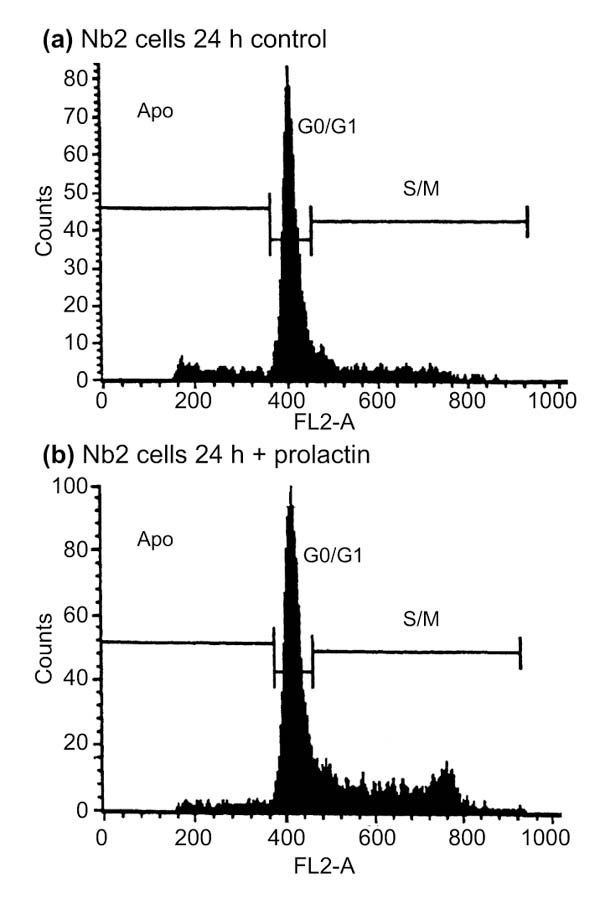
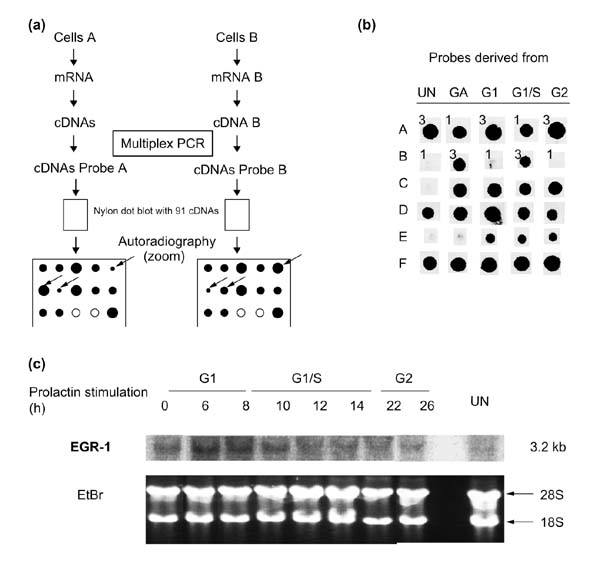
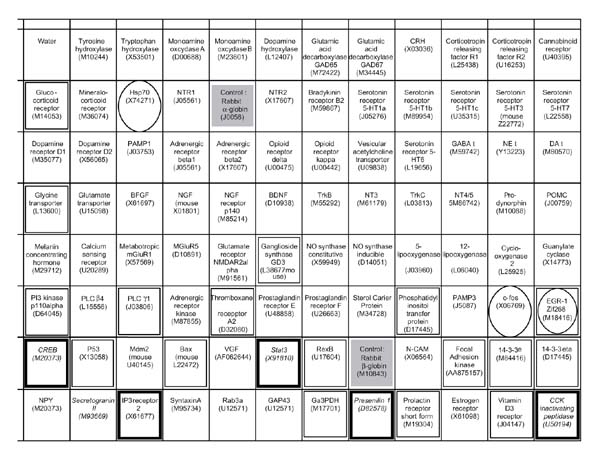
Background: Rat Nb2-11C lymphoma cells are dependent on prolactin for proliferation and are widely used to study prolactin signaling pathways. To investigate the role of this hormone in the transcriptional mechanisms that underlie prolactin-stimulated mitogenesis, five different techniques were used to isolate differentially expressed transcripts: mRNA differential display, representational difference analysis (RDA), subtractive suppressive hybridization (SSH), analysis of weakly expressed candidate genes, and differential screening of an organized library.
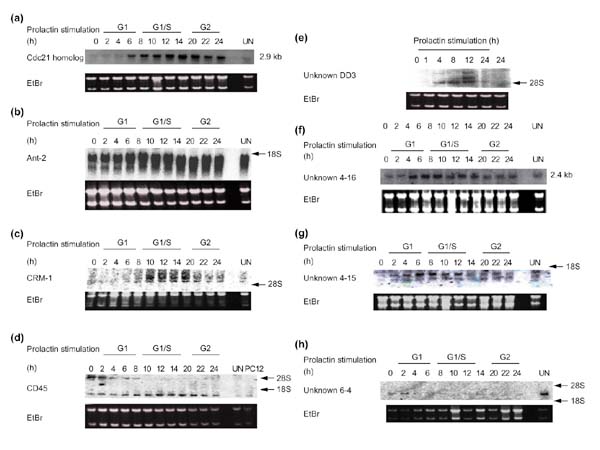
Results: About 70 transcripts were found to be modulated in Nb2 cells following prolactin treatment. Of these, approximately 20 represent unknown genes. All cDNAs were characterized by northern blot analysis and categorized on the basis of their expression profiles and the functions of the known genes. We compared our data with other cell-cycle-regulated transcripts and found several new potential signaling molecules that may be involved in Nb2 cell growth. In addition, abnormalities in the expression patterns of several transcripts were detected in Nb2 cells, including the constitutive expression of the immediate-early gene EGR-1. Finally, we compared the differential screening techniques in terms of sensitivity, efficiency and occurrence of false positives.
Conclusions: Using these techniques to determine which genes are differentially expressed in Nb2 lymphoma cells, we have obtained valuable insight into the potential functions of some of these genes in the cell cycle. Although this information is preliminary, comparison with other eukaryotic models of cell-cycle progression enables identification of expression abnormalities and proteins potentially involved in signal transduction, which could indicate new directions for research.
Figures
Similar articles
-
Coordinate gene expression of luteinizing hormone-releasing hormone (LHRH) and the LHRH-receptor after prolactin stimulation in the rat Nb2 T-cell line: implications for a role in immunomodulation and cell cycle gene expression.Mol Endocrinol. 1995 Jan;9(1):44-53. doi: 10.1210/mend.9.1.7760850. Mol Endocrinol. 1995. PMID: 7760850
-
Alterations in pim-1 and c-myc expression associated with sodium butyrate-induced growth factor dependency in autonomous rat Nb2 lymphoma cells.Cell Growth Differ. 1996 Dec;7(12):1713-21. Cell Growth Differ. 1996. PMID: 8959340
-
Prolactin induces expression of FGF-2 and a novel FGF-responsive NonO/p54nrb-related mRNA in rat lymphoma cells.Mol Cell Endocrinol. 1998 Feb;137(2):187-95. doi: 10.1016/s0303-7207(97)00240-2. Mol Cell Endocrinol. 1998. PMID: 9605521
-
Use of cDNA cloning to study the mechanism of action of glucocorticoid hormones at the molecular level.Braz J Med Biol Res. 1996 Dec;29(12):1751-7. Braz J Med Biol Res. 1996. PMID: 9222440 Review.
-
A decade of differential display.Biotechniques. 2002 Aug;33(2):338-44, 346. doi: 10.2144/02332rv01. Biotechniques. 2002. PMID: 12188186 Review.
Cited by
-
Effects of prolactin on cloned human T-lymphocytes.Endocrine. 2003 Feb-Mar;20(1-2):171-6. doi: 10.1385/endo:20:1-2:171. Endocrine. 2003. PMID: 12668883
-
Applying a highly specific and reproducible cDNA RDA method to clone garlic up-regulated genes in human gastric cancer cells.World J Gastroenterol. 2002 Apr;8(2):213-6. doi: 10.3748/wjg.v8.i2.213. World J Gastroenterol. 2002. PMID: 11925594 Free PMC article.
-
Endocrine regulation of heat shock protein mRNA levels in long-lived dwarf mice.Mech Ageing Dev. 2009 Jun;130(6):393-400. doi: 10.1016/j.mad.2009.03.004. Epub 2009 Apr 8. Mech Ageing Dev. 2009. PMID: 19428459 Free PMC article.
-
Using gene expression arrays to elucidate transcriptional profiles underlying prolactin function.J Mammary Gland Biol Neoplasia. 2003 Jul;8(3):269-85. doi: 10.1023/b:jomg.0000010029.85796.63. J Mammary Gland Biol Neoplasia. 2003. PMID: 14973373 Review.
-
Prolactin induces Egr-1 gene expression in cultured hypothalamic cells and in the rat hypothalamus.Brain Res. 2009 Dec 11;1302:34-41. doi: 10.1016/j.brainres.2009.09.047. Epub 2009 Sep 18. Brain Res. 2009. PMID: 19769948 Free PMC article.
References
-
- Bole-Feysot C, Goffin V, Edery M, Binart N, Kelly PA. Prolactin (PRL) and its receptor: actions, signal transduction pathways and phenotypes observed in PRL receptor knockout mice. Endocr Rev. 1998;19:225–268. - PubMed
-
- Yu-Lee LY. Molecular actions of prolactin in the immune system. . Proc Soc Exp Biol Med. 1997;215:35–52. - PubMed
-
- Clevenger CV, Freier DO, Kline JB. Prolactin receptor signal transduction in cells of the immune system. J Endocrinol. 1998;157:187–197. - PubMed
-
- Richards JF, Beer CT, Bourgeault C, Chen K, Gout PW. Biochemical response of lymphoma cells to mitogenic stimulation by prolactin. . Mol Cell Endocrinol. 1982;26:41–49. - PubMed
-
- Gertler A, Walker A, Friesen HG. Enhancement of human growth hormone-stimulated mitogenesis of Nb2 node lymphoma cells by 12-O-tetradecanoyl-phorbol-13-acetate. Endocrinology. 1985;116:1636–1644. - PubMed
Publication types
MeSH terms
Substances
LinkOut - more resources
Full Text Sources
