. 2001;2(1):RESEARCH0003.
doi: 10.1186/gb-2001-2-1-research0003. Epub 2001 Jan 10.

Supervised harvesting of expression trees

Affiliations

Supervised harvesting of expression trees

T Hastie et al. Genome Biol. 2001.

Abstract

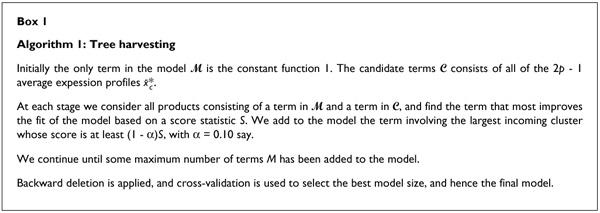
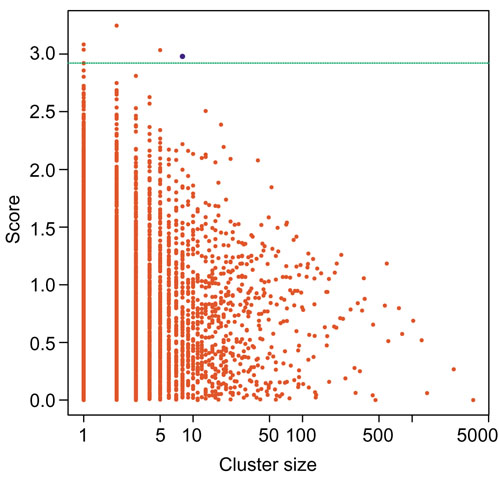
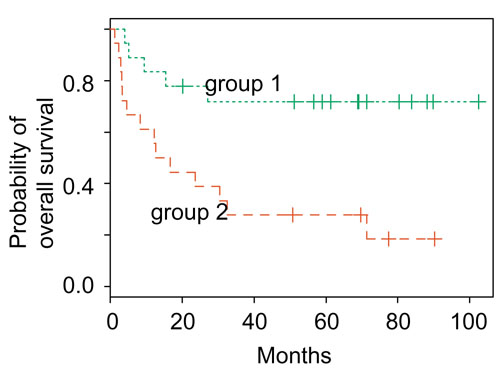
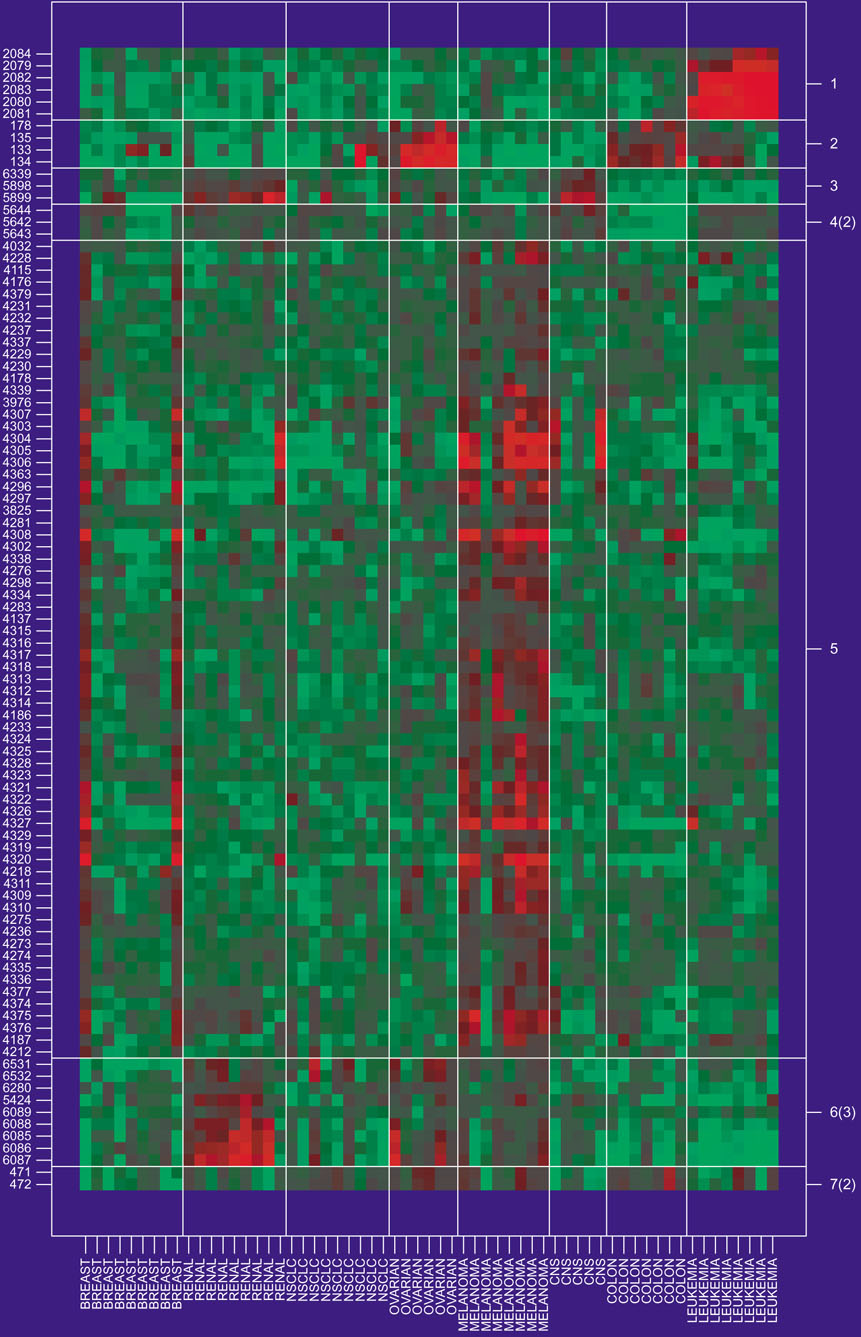
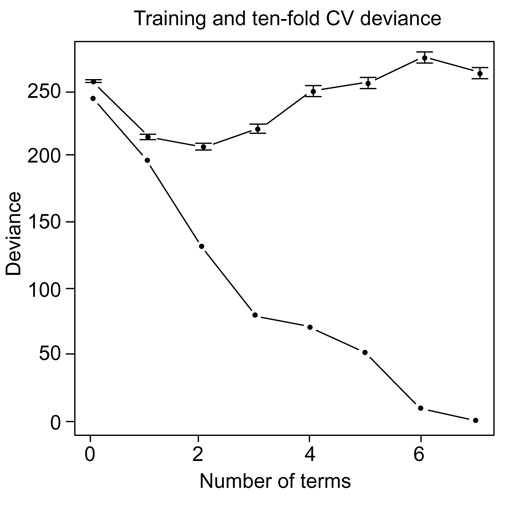
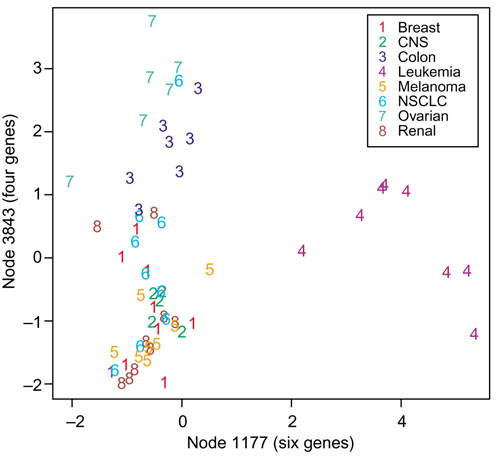
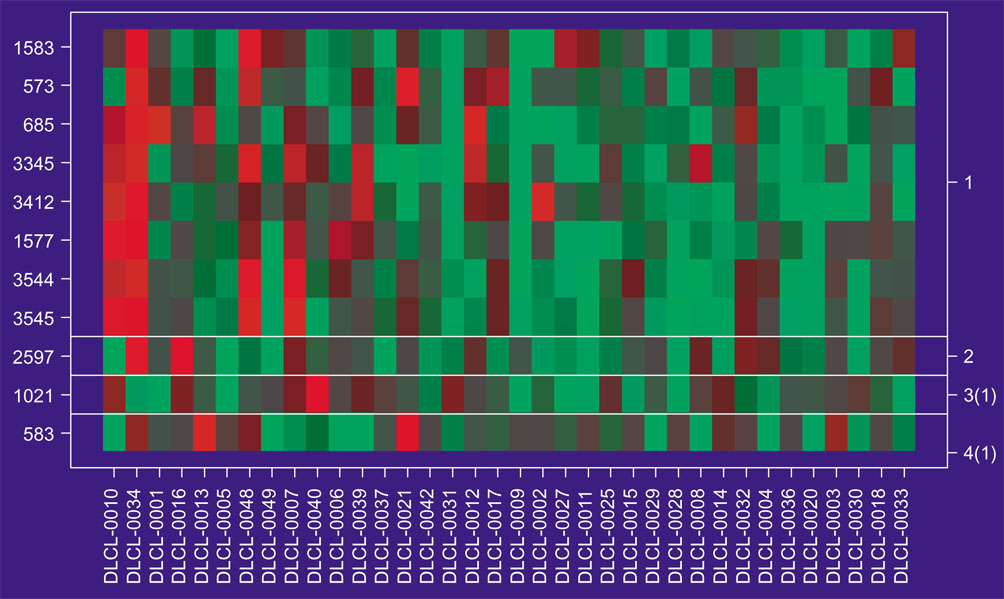
Background: We propose a new method for supervised learning from gene expression data. We call it 'tree harvesting'. This technique starts with a hierarchical clustering of genes, then models the outcome variable as a sum of the average expression profiles of chosen clusters and their products. It can be applied to many different kinds of outcome measures such as censored survival times, or a response falling in two or more classes (for example, cancer classes). The method can discover genes that have strong effects on their own, and genes that interact with other genes.

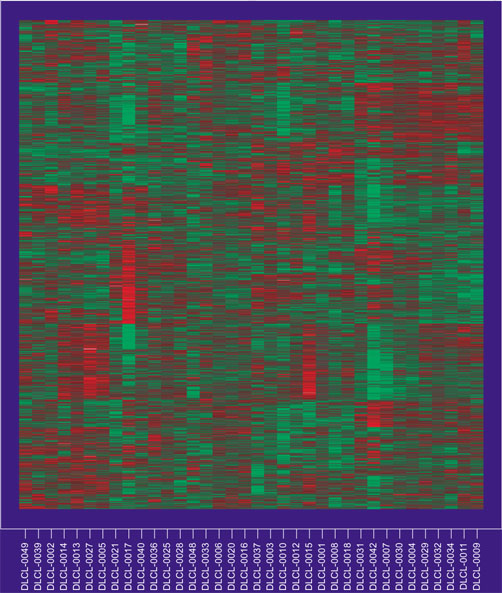
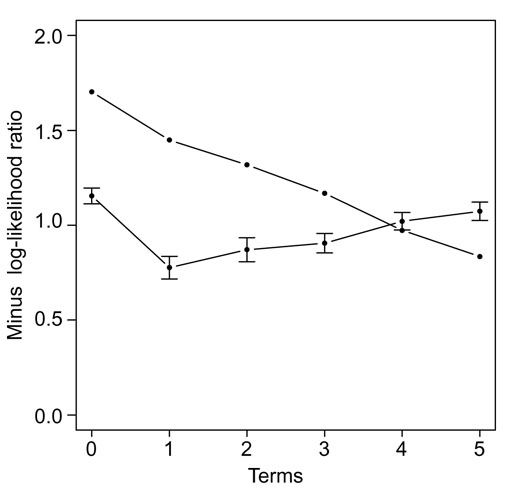
Results: We illustrate the method on data from a lymphoma study, and on a dataset containing samples from eight different cancers. It identified some potentially interesting gene clusters. In simulation studies we found that the procedure may require a large number of experimental samples to successfully discover interactions.

Conclusions: Tree harvesting is a potentially useful tool for exploration of gene expression data and identification of interesting clusters of genes worthy of further investigation.


Figures

Box 1
Box 1
Algorithm 1: Tree harvesting.
Figure 1
Figure 1
The DLCL expression matrix, with rows and columns ordered according to a hierarchical clustering applied separately to the rows and columns.
Figure 2
Figure 2
Scores for each cluster, from the first stage of the harvest procedure. The green horizontal line is drawn at (1 - α) times the maximum score, with α = 0.1. The largest cluster having a score above this line is chosen, indicated by the blue plotting symbol.
Figure 3
Figure 3
Lymphoma data. Clusters from tree harvest procedure, with columns in (expected) survival time order.
Figure 4
Figure 4
Lymphoma data. Training error curve (upper curve) and cross-validation error curve (lower curve with error bars).
Figure 5
Figure 5
Survival curves of the two groups defined by the low or high expression of genes in the first cluster from tree harvesting. Group 1 has low gene expression, and group 2 has high gene expression. The survival in the groups is significantly different (p = 2.4 × 10⁻⁵).
Figure 6
Figure 6
The seven clusters found by tree harvesting for predicting the tumor classes. They are ordered from top to bottom in terms of stepwise entry into the model. The vertical boundaries separate cancer classes.
Figure 7
Figure 7
Model deviance for the tumor data. The lower curve is on the training data, and reaches 0 after seven terms (a saturated fit). The 0th term is the constant fit. The upper curve is based on ten-fold cross-validation, where care was taken to balance the class distribution in each fold.
Figure 8
Figure 8
Plot of average expression for each of the first two clusters, with samples identified by cancer class. Some clear separation is apparent.
Figure 9
Figure 9
Lymphoma data: clusters from tree harvest nonlinear model, with columns in (expected) survival time order.

References

    1. Hastie T, Tibshirani R, Eisen M, Alizadeh A, Levy R, Staudt L, Botstein D, Brown P. 'Gene shaving' as a method of identifying distinct sets of genes with similar expression patterns. Genome Biology. 2000;1:research0003.1–0003.21. - PMC - PubMed
    1. Eisen M, Spellman P, Brown P, Botstein D. Cluster analysis and display of genome-wide expression patterns. Proc Natl Acad Sci USA. 1998;95:14863–14868. - PMC - PubMed
    1. Friedman J. Multivariate adaptive regression splines. Annl Stat. 1991;19:1–141.
    1. Tamayo P, Slonim D, Mesirov J, Zhu Q, Kitareewan S, Dmitrovsky E, Lander E, Golub T. Interpreting patterns of gene expression with self-organizing maps: methods and application to hematopoietic differentiation. Proc Natl Acad Sci USA. 1999;96:2907–2912. - PMC - PubMed
    1. Alizadeh A, Eisen M, Davis RE, Ma C, Lossos I, Rosenwal A, Boldrick J, Sabet H, Tran T, Yu X, et al. Distinct types of diffuse large B-cell lymphoma identified by gene expression profiling. Nature. 2000;403:503–511. doi: 10.1038/35000501. - DOI - PubMed

LinkOut - more resources