

mtDna and the islands of the North Atlantic: estimating the proportions of Norse and Gaelic ancestry
- PMID: 11179019
- PMCID: PMC1274484
- DOI: 10.1086/318785
mtDna and the islands of the North Atlantic: estimating the proportions of Norse and Gaelic ancestry
Abstract
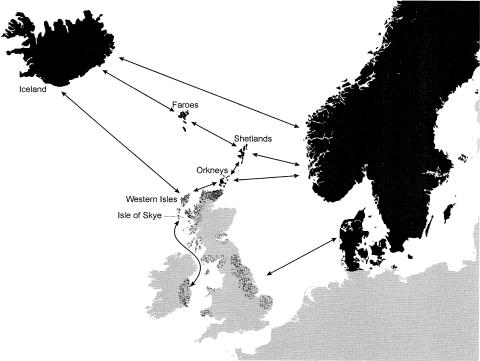
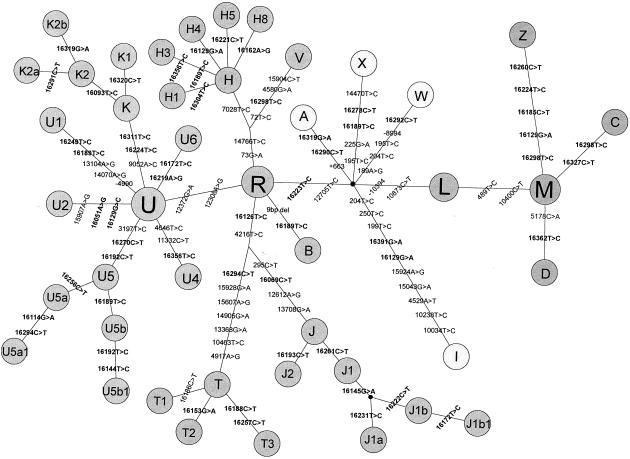
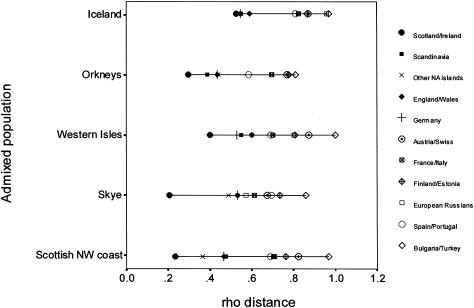
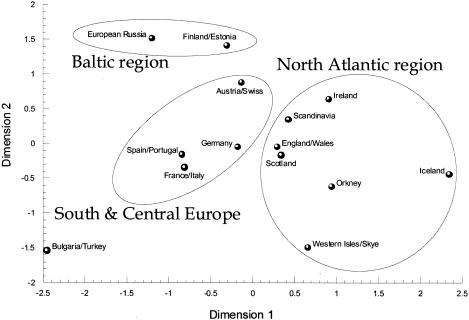
A total of 1,664 new mtDNA control-region sequences were analyzed in order to estimate Gaelic and Scandinavian matrilineal ancestry in the populations of Iceland, Orkney, the Western Isles, and the Isle of Skye and to investigate other aspects of their genetic history. A relative excess of private lineages in the Icelanders is indicative of isolation, whereas the scarcity of private lineages in Scottish island populations may be explained by recent gene flow and population decline. Differences in the frequencies of lineage clusters are observed between the Scandinavian and the Gaelic source mtDNA pools, and, on a continent-wide basis, such differences between populations seem to be associated with geography. A multidimensional scaling analysis of genetic distances, based on mtDNA lineage-cluster frequencies, groups the North Atlantic islanders with the Gaelic and the Scandinavian populations, whereas populations from the central, southern, and Baltic regions of Europe are arranged in clusters in broad agreement with their geographic locations. This pattern is highly significant, according to a Mantel correlation between genetic and geographic distances (r=.716). Admixture analyses indicate that the ancestral contributions of mtDNA lineages from Scandinavia to the populations of Iceland, Orkney, the Western Isles, and the Isle of Skye are 37.5%, 35.5%, 11.5%, and 12.5%, respectively.
Figures

References
Electronic-Database Information
-
- GenBank, http://www.ncbi.nlm.nih.gov/Web/Genbank/index.html (for study results [accession numbers AY026032–AY026032])
-
- Mitochondrial DNA Concordance, http://shelob.bioanth.cam.ac.uk/mtDNA (for mtDNA HVS1 sequences)
References
-
- Anderson S, Bankier AT, Barrell BG, Debruijn MHL, Coulson AR, Drouin J, Eperon IC, Nierlich DP, Roe BA, Sanger F, Schreier PH, Smith AJH, Staden R, Young IG (1981) Sequence and organization of the human mitochondrial genome. Nature 290:457–465 - PubMed
-
- Bandelt HJ, Forster P, Rohl A (1999) Median-joining networks for inferring intraspecific phylogenies. Mol Biol Evol 16:37–48 - PubMed
-
- Bodmer JG, DeLuca M, Moses JH, Heyes JM, Marsh SGE (1996) HLA class I and II study in an Orcadian population. Hum Immunol 47:O265 - PubMed
-
- Boyce AJ, Holdsworth VML, Brothwell DR (1973) Demographic and genetic studies in the Orkney Islands. In: Roberts DF, Sunderland E (eds) Genetic variation in Britain. Taylor and Francis, London
-
- Berry RJ, Muir VML (1975) The natural history of man in Shetland. J Biosoc Sci 7:319–344 - PubMed
Publication types
MeSH terms
Substances
Associated data
- Actions
LinkOut - more resources
Full Text Sources
Other Literature Sources
Molecular Biology Databases
