Assessment of coronary reperfusion in patients with myocardial infarction using fatty acid binding protein concentrations in plasma
- PMID: 11179265
- PMCID: PMC1729633
- DOI: 10.1136/heart.85.3.278
Assessment of coronary reperfusion in patients with myocardial infarction using fatty acid binding protein concentrations in plasma
Abstract
Objective: To examine whether successful coronary reperfusion after thrombolytic treatment in patients with confirmed acute myocardial infarction can be diagnosed from the plasma marker fatty acid binding protein (FABP), for either acute clinical decision making or retrospective purposes.
Design: Retrospective substudy of the GUSTO trial.
Setting: 10 hospitals in four European countries.
Patients: 115 patients were treated with thrombolytic agents within six hours after the onset of acute myocardial infarction. Patency of the infarct related artery was determined by angiography within 120 minutes of the start of thrombolysis.
Main outcome measures: First hour rate of increase in plasma FABP concentration after thrombolytic treatment, compared with increase in plasma myoglobin concentration and creatine kinase isoenzyme MB (CK-MB) activity. Infarct size was estimated from the cumulative release of the enzyme alpha hydroxybutyrate dehydrogenase in plasma during 72 hours, or from the sum of ST segment elevations on admission. Logistic regression analyses were performed to construct predictive models for patency.
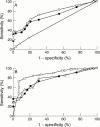
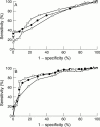
Results: Complete reperfusion (TIMI 3) occurred in 50 patients, partial reperfusion (TIMI 2) in 36, and no reperfusion (TIMI 0+1) in 29. Receiver operating characteristic (ROC) curve analyses showed that the best performance of FABP was obtained when TIMI scores 2 and 3 were grouped and compared with TIMI score 0+1. The performance of FABP as a reperfusion marker was improved by combining it with alpha hydroxybutyrate dehydrogenase infarct size, but not with an early surrogate of infarct size (ST segment elevation on admission). In combination with infarct size FABP performed as well as myoglobin (areas under the ROC curve 0.868 and 0.857, respectively) and better than CK-MB (area = 0.796). At optimum cut off levels, positive predictive values were 97% for FABP, 95% for myoglobin, and 89% for CK-MB (without infarct size, 87%, 88%, and 87%, respectively), and negative predictive values were 55%, 52%, and 50%, respectively (without infarct size, 44%, 42%, and 34%).
Conclusions: FABP and myoglobin perform equally well as reperfusion markers, and successful reperfusion can be assessed, with positive predictive values of 87% and 88%, or even 97% and 95% when infarct size is also taken into account. However, identification of non-reperfused patients remains a problem, as negative predictive values will generally remain below 70%.
Figures


Similar articles
-
Human heart-type cytoplasmic fatty acid-binding protein (H-FABP) for the diagnosis of acute myocardial infarction. Clinical evaluation of H-FABP in comparison with myoglobin and creatine kinase isoenzyme MB.Clin Chem Lab Med. 2000 Mar;38(3):231-8. doi: 10.1515/CCLM.2000.034. Clin Chem Lab Med. 2000. PMID: 10905760
-
Fatty-acid-binding protein as a plasma marker for the estimation of myocardial infarct size in humans.Br Heart J. 1994 Feb;71(2):135-40. doi: 10.1136/hrt.71.2.135. Br Heart J. 1994. PMID: 8130020 Free PMC article.
-
Heart-type fatty acid binding protein as a marker of reperfusion after thrombolytic therapy.Clin Chim Acta. 2000 Aug;298(1-2):85-97. doi: 10.1016/s0009-8981(00)00259-x. Clin Chim Acta. 2000. PMID: 10876006
-
[Detection of coronary reperfusion using biochemical markers].Nihon Rinsho. 1994 Jul;52 Suppl(Pt 1):813-9. Nihon Rinsho. 1994. PMID: 12436621 Review. Japanese. No abstract available.
-
[Enzymatic markers of reperfusion in acute myocardial infarct. With data from the ISAM study].Herz. 1999 Oct;24(6):430-9. doi: 10.1007/BF03044429. Herz. 1999. PMID: 10546147 Review. German.
Cited by
-
Candidate-based proteomics in the search for biomarkers of cardiovascular disease.J Physiol. 2005 Feb 15;563(Pt 1):23-60. doi: 10.1113/jphysiol.2004.080473. Epub 2004 Dec 20. J Physiol. 2005. PMID: 15611012 Free PMC article. Review.
-
Heart-fatty acid-binding protein as a marker for early detection of acute myocardial infarction and stroke.Mol Diagn. 2005;9(1):1-7. doi: 10.2165/00066982-200509010-00001. Mol Diagn. 2005. PMID: 16035729 Review.
-
New biomarkers in the risk stratification of patients with suspected acute myocardial infarction.Curr Cardiol Rep. 2002 Jul;4(4):341-7. doi: 10.1007/s11886-002-0071-z. Curr Cardiol Rep. 2002. PMID: 12052274 Review.
-
Sorting through new biomarkers.Curr Cardiol Rep. 2008 Jul;10(4):319-26. doi: 10.1007/s11886-008-0051-z. Curr Cardiol Rep. 2008. PMID: 18611367
References
Publication types
MeSH terms
Substances
LinkOut - more resources
Full Text Sources
Medical
Research Materials
Miscellaneous
