. 2001 Mar;69(3):1722-8.
doi: 10.1128/IAI.69.3.1722-1728.2001.

Temporal and spatial arrangement of lymphocytes within lung granulomas induced by aerosol infection with Mycobacterium tuberculosis

Affiliations

Temporal and spatial arrangement of lymphocytes within lung granulomas induced by aerosol infection with Mycobacterium tuberculosis

M Gonzalez-Juarrero et al. Infect Immun. 2001 Mar.

Abstract

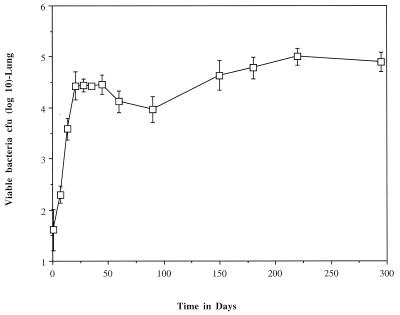
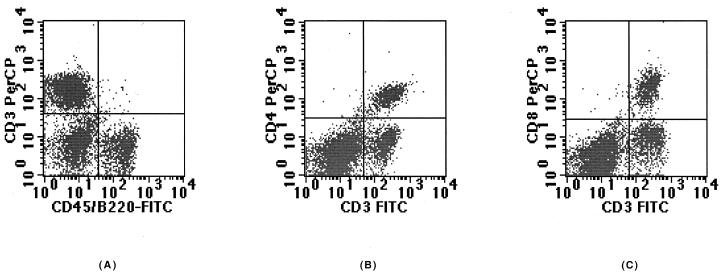
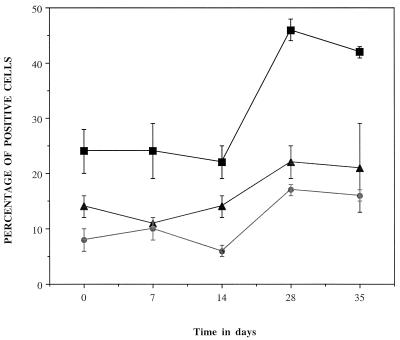
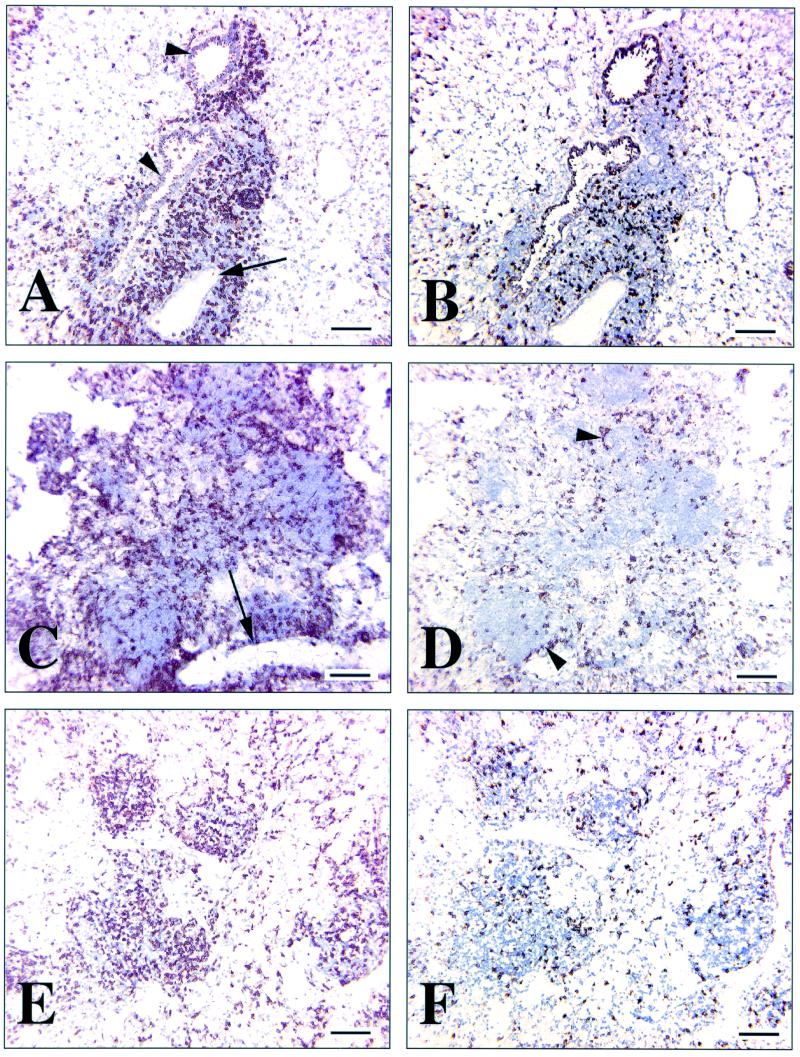
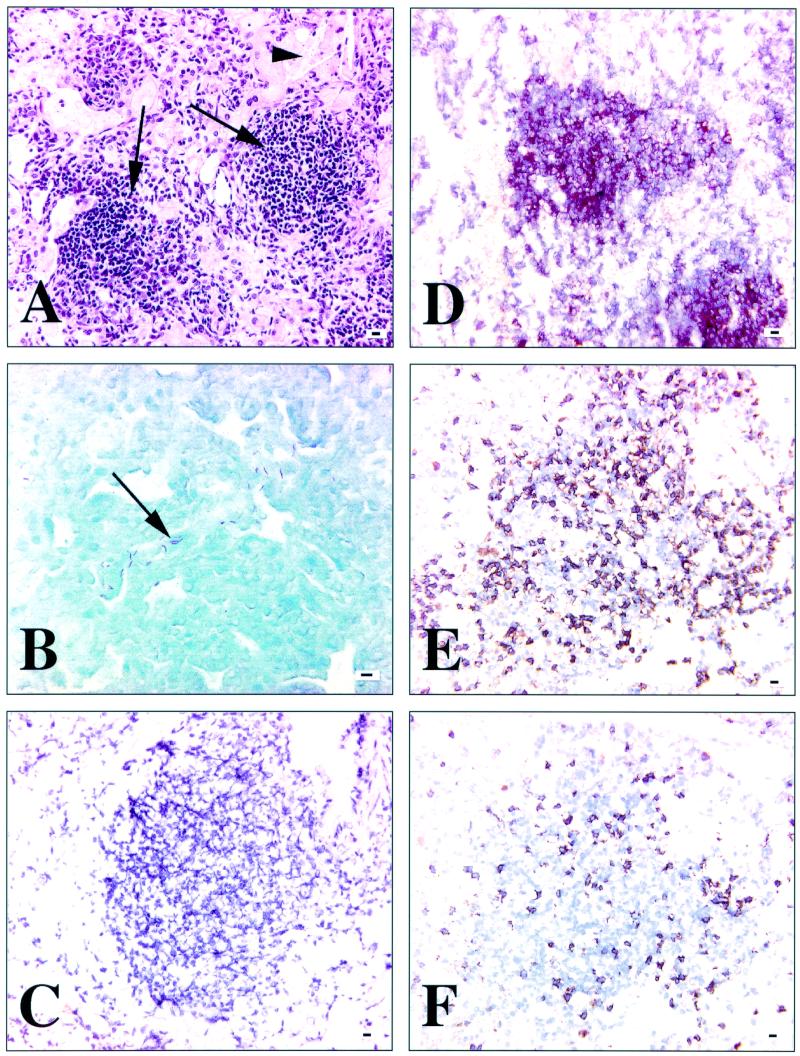
The progression of the immune response in the lungs after aerosol infection with Mycobacterium tuberculosis is a complex cellular event dominated by macrophages and lymphocytes. Although the phenotype of lymphocytes participating in this response is becoming increasingly well characterized, the dynamic influx of these cells during the infection and their spatial arrangements within the lung tissue are still poorly understood. This study shows that in the first month after aerosol infection with M. tuberculosis there was a steady increase in the percentages of total CD3+, CD3+ CD4+ and CD3+ CD8+ cells, with consistently larger numbers of CD3+ CD4+ cells than of CD3+ CD8+ cells. As granuloma formation continued, the granuloma was found to consist of macrophages, CD4, and CD8 T cells, as well as a smaller number of B cells. Whereas CD4 T cells formed organized aggregates, CD8 T cells were fewer and more scattered and tended to be more prominent toward the periphery of the granulomas. The possible ramifications of the juxtapositions of these two major T-cell subsets are discussed.


Figures

FIG. 1
FIG. 1
Course of infection in the lungs of C57BL/6 mice following low-dose aerosol exposure to M. tuberculosis Erdman. Data are representative of three experiments and are expressed as the mean number of viable bacteria at 0, 7, 14, 21, 28, 35, 45, 60, 90, 150, 180, 220, and 295 days p.i. Standard deviations are indicated by vertical bars. Four mice were used at each time point.
FIG. 2
FIG. 2
Flow cytometric dot plot analysis for CD3+, CD4+, CD8+, and CD45/RB220+ positive lymphocytes obtained after counting 30,000 events. Data are from one mouse infected for 35 days and are representative of the experimental group (eight mice from two independent experiments).
FIG. 3
FIG. 3
Flow cytometric assessment of the percentages of CD3+ (■), CD3+ CD4+ (▴), and CD3+ CD8+ (●) cells in the lungs during the first 35 days of infection. Cells were gated for lymphocytes by their characteristic forward- and side-scatter profile, and 30,000 events in the lymphocyte gate per sample were counted. Data are expressed as the mean percentage of positive cells from four individual mice. Standard deviations are indicated by the vertical bars. Data are representative of two independent experiments.
FIG. 4
FIG. 4
Immunohistochemical staining of CD4+ and CD8+ lymphocytes in frozen sections of lung tissue from C57BL/6 mice at sequential time points after low-dose aerosol infection with M. tuberculosis. Each field is representative of the pulmonary lymphocytic accumulation at the indicated time point. (A) CD4+ staining of lymphocytes after 30 days. Note the presence of a dense accumulation of positive cells around airways (arrowheads) and a vein (arrow). There were a few scattered positive cells in the surrounding parenchyma. (B) CD8+ staining of lymphocytes after 30 days. Note the sparse distribution of positive cells within the same peribronchiolar and perivascular area. There were a few positive cells in the surrounding parenchyma. (C) CD4+ staining of lymphocytes after 100 days. Note the dense accumulation of positive cells throughout the lesion, which is associated with a large vein (arrow). (D) CD8+ staining of lymphocytes after 100 days. Note the sparse distribution of positive cells throughout the lesion, with increased numbers and aggregation of these cells at the periphery of the lesion (arrowheads). (E) CD4+ staining of cells lymphocytes after 250 days. Note the dense accumulation of positive cells throughout the lesion. (F) CD8+ staining of lymphocytes after 250 days. Note the sparse distribution of CD8+ cells throughout the lesion. These are serial sections with 5 to 10 μm separating each couplet and are representative of three experiments. Ba, 100 μm.
FIG. 5
FIG. 5
Immunohistochemical staining of frozen sections of lungs from C57BL/6 mice with chronic M. tuberculosis infection (220 to 280 days p.i.). Panels A and B are paraffin sections, and panels C to F are frozen sections. (A) Hematoxylin and eosin stain after 250 days. Islands of lymphocytes (arrows) surrounded by epithelioid macrophages. Cholesterol clefts (arrowhead) are indicative of chronic disease. (B) Kinyoun's acid-fast stain after 250 days. Note the multiple red, rod-shaped bacilli. (C) Isotype control after 280 days. Note no positive staining. (D) CD45/RB220+ staining of lymphocytes using AEC chromogen after 280 days. Specific positive staining is concentrated in the central portion of the lymphoid aggregate. (E) CD4+ staining of lymphocytes using DAB chromogen after 250 days. There is abundant positive staining throughout the lymphoid aggregate. (F) CD8+ staining of lymphocytes using DAB chromogen after 250 days. There is sparse positive staining throughout the same lymphoid aggregate as represented in panel E. All images are representative of three experiments. Bars, 10 μm.

References

    1. Boom W H, Chervenak K A, Mincek M A, Ellner J J. Role of the mononuclear phagocyte as an antigen-presenting cell for human γδ T cells activated by live Mycobacterium tuberculosis. Infect Immun. 1992;60:3480–3488. - PMC - PubMed
    1. Bosio C, Gardner D, Elkins K L. Infection of B cell-deficient mice with CDC1551, a clinical isolate of Mycobacterium tuberculosis: delay in dissemination and development of lung pathology. J Immunol. 2000;164:6417–6425. - PubMed
    1. Cardona P J, Cooper A M, Luquin M, Ariza A, Filipo F, Orme I M, Ausina V. The intravenous model of murine tuberculosis is less pathogenic than the aerosol model owing to a more rapid induction of systemic immunity. Scand J Immunol. 1999;49:362–366. - PubMed
    1. Caruso A M, Serbina N, Klein E, Triebold K, Bloom B R, Flynn J L. Mice deficient in CD4 T cells have only transiently diminished levels of IFN-γ, yet succumb to tuberculosis. J Immunol. 1999;162:5407–5416. - PubMed
    1. Cooper A M, Callahan J E, Keen M, Belisle J T, Orme I M. Expression of memory immunity in the lung following re-exposure to Mycobacterium tuberculosis. Tubercle Lung Dis. 1997;78:67–73. - PubMed

Publication types