. 2001 Feb;12(2):297-308.
doi: 10.1091/mbc.12.2.297.

Genome-wide responses to mitochondrial dysfunction

Affiliations
Free PMC article

Genome-wide responses to mitochondrial dysfunction

C B Epstein et al. Mol Biol Cell. 2001 Feb.
Free PMC article

Abstract

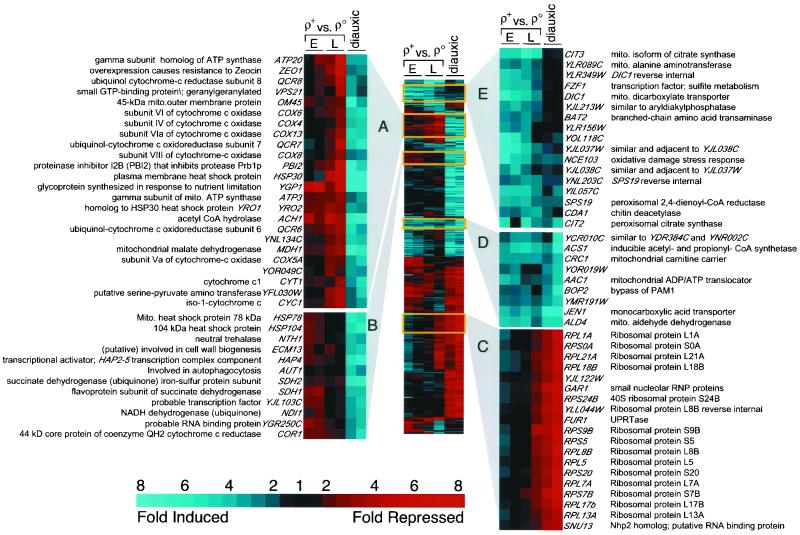
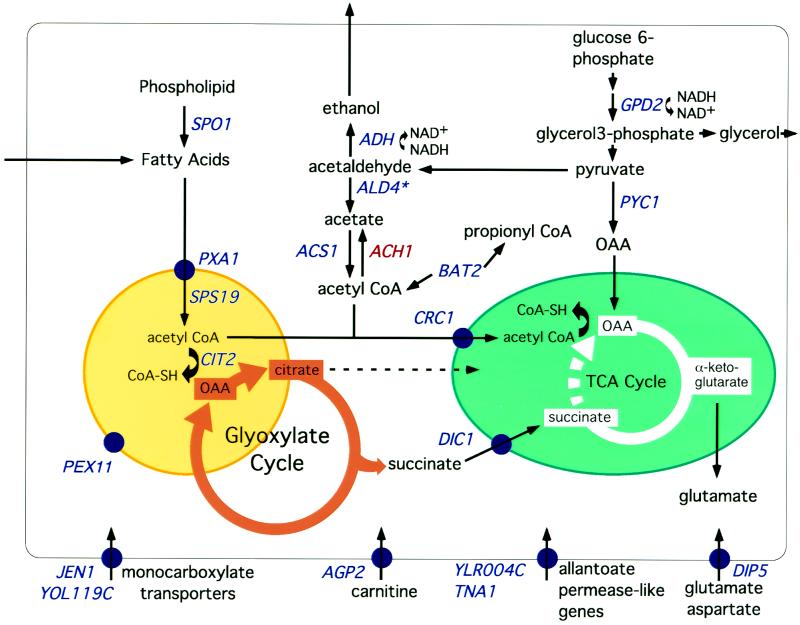
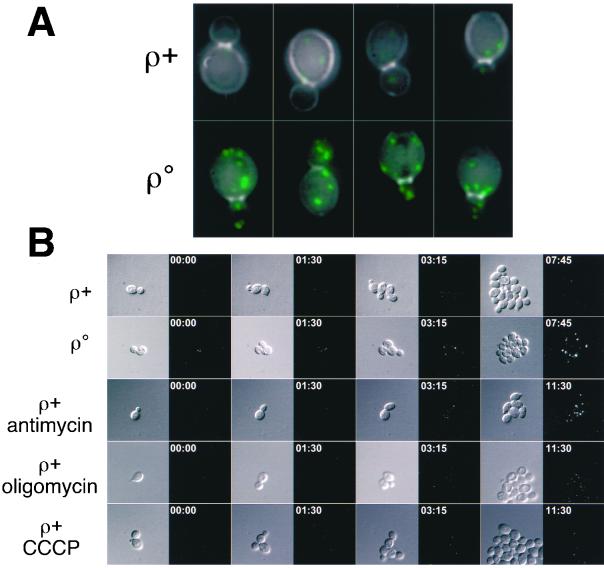
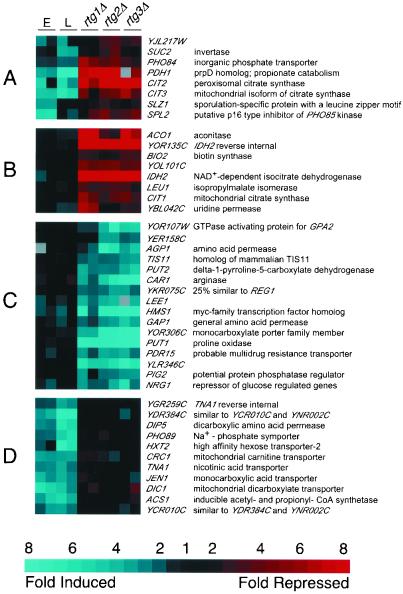
Mitochondrial dysfunction can lead to diverse cellular and organismal responses. We used DNA microarrays to characterize the transcriptional responses to different mitochondrial perturbations in Saccharomyces cerevisiae. We examined respiratory-deficient petite cells and respiratory-competent wild-type cells treated with the inhibitors of oxidative phosphorylation antimycin, carbonyl cyanide m-chlorophenylhydrazone, or oligomycin. We show that respiratory deficiency, but not inhibition of mitochondrial ATP synthesis per se, induces a suite of genes associated with both peroxisomal activities and metabolite-restoration (anaplerotic) pathways that would mitigate the loss of a complete tricarboxylic acid cycle. The array data suggested, and direct microscopic observation of cells expressing a derivative of green fluorescent protein with a peroxisomal matrix-targeting signal confirmed, that respiratory deficiency dramatically induces peroxisome biogenesis. Transcript profiling of cells harboring null alleles of RTG1, RTG2, or RTG3, genes known to control signaling from mitochondria to the nucleus, suggests that there are multiple pathways of cross-talk between these organelles in yeast.


Figures

Figure 1
Figure 1
2-D cluster analysis of gene expression in ρo versus ρ+ cells. The first four columns from left to right are replicate hybridizations of cDNAs prepared from early (E; OD600 = 0.5) and late (L; OD600 = 1.5) log phase cultures of ρ+ versus ρo cells differentially labeled with Cy3 and Cy5. Data from DeRisi et al. (1997) for the last two time points in the diauxic shift of glucose-grown ρ+ cells (OD600 = 6.9 and 7.3) are included in the last two columns on the right, indicated as diauxic. All 402 genes showing at least a threefold change in at least two hybridizations are shown. Blue denotes genes induced in ρo relative to ρ+ or induced during the diauxic shift, and red refers to repressed genes. Mito, mitochondrial; RNP, ribonucleoprotein; UPRT, uracil phosphoribosyl transferase.
Figure 2
Figure 2
Metabolic pathways affected in respiratory-deficient cells as inferred from transcript profiling. Nineteen of the 34 genes induced in ρo petites (Table 1A) and having some functional description are indicated in blue. Also included in the display in red is ACH1, whose expression is strongly down-regulated in ρo cells. A peroxisome is indicated by the yellow circle and a mitochondrion by the green ellipse. TCA cycle flux from succinate to OAA is blocked (broken line) in respiratory-deficient cells. Gene products associated with a particular membrane are indicated by blue circles. On our array, the spots for ADH1 and ADH2 both showed induction in ρo cells. However, because of 157 nucleotides of contiguous identity between these two genes, transcripts of ADH1 and ADH2 cannot be distinguished by microarray probes targeting entire reading frames.
Figure 3
Figure 3
PDH1 is a retrograde regulated gene and may function in propionate metabolism. (A) Northern blots showing increased abundance of PDH1 and CIT2 transcripts in ρo compared with ρ+ cells at three different cell densities. (B) Growth of wild-type (WT) and pdh1Δ cells on YNB 1% casein medium with or without propionate and containing limiting amounts of raffinose as indicated. (C) Growth of wild-type (WT) and pdh1Δ cells on YNB, 1% casein, 0.05% raffinose medium with or without propionate or acetate as indicated.
Figure 4
Figure 4
Peroxisome induction in respiratory-deficient cells. (A) Overlay between Calcofluor White staining (gray) and GFP peroxisomal marker (green) in representative ρ+ and ρ° cells. Each image is a 2-D projection of a 3-D image of the entire cell volume. The images were generated with a fixed exposure time and illumination intensity and a camera with a dynamic range exceeding 3 orders of magnitude. (B) Selected time points from 3-D, time-lapse recordings comparing peroxisome biogenesis in respiratory-competent, respiratory-deficient, and drug-treated cells. The DIC images are taken from an equatorial focal plane, whereas the GFP images are 2-D projections showing all peroxisomes in the image volume above a fixed intensity range. Annotation indicates elapsed time in hours:minutes format from start of experiment. Because the drug-treated cells grow slower than untreated ρ+ and ρo cells, a later time point is used for the final images in the drug-treated samples.
Figure 5
Figure 5
Effects of RTG mutations in ρo cells. The four columns on the left are replicate comparisons of early (E) and late (L) log phase ρ+ and ρo cultures, as detailed in the legend to Figure 1. The six columns on the right are replicate comparisons of ρo cells and ρo cells containing deletions of rtg1, 2, or 3, respectively, and are based on cultures harvested at an OD600 = 0.8. (A–C) Genes whose expression is affected by RTG1, 2, and 3 in ρo cells. (D) A group of genes induced by respiratory deficiency in an RTG-independent manner. Blue refers to genes induced in ρo relative to ρ+ or induced in ρo rtg relative to ρo RTG. Red refers to repressed genes. All 273 genes that changed by at least threefold in at least two experiments are shown.

References

    1. Baysal BE, Ferrell RE, Willett-Brozick JE, Lawrence EC, Myssiorek D, Bosch A, van der Mey A, Taschner PE, Rubinstein WS, Myers EN, Richard C W, 3rd, Cornelisse CJ, Devilee P, Devlin B. Mutations in SDHD, a mitochondrial complex II gene, in hereditary paraganglioma. Science. 2000;287:848–851. - PubMed
    1. Bork P, Sander C, Valencia A. An ATPase. domain common to prokaryotic cell cycle proteins, sugar kinases, actin and hsp70 heat shock proteins. Proc Natl Acad Sci USA. 1992;89:7290–7294. - PMC - PubMed
    1. Brachmann CB, Davies A, Cost GJ, Caputo E, Li JC, Hieter P, Boeke JD. Designer deletion strains derived from Saccharomyces cerevisiae S288C: a useful set of strains and plasmids for PCR-mediated gene disruption and other applications. Yeast. 1998;14:115–132. - PubMed
    1. Chelstowska A, Butow RA. RTG genes in yeast that function in communication between mitochondria and the nucleus are also required for expression of genes encoding peroxisomal proteins. J Biol Chem. 1995;270:18141–18146. - PubMed
    1. Cherry JM, Adler C, Ball C, Chervitz SA, Dwight SS, Hester ET, Jia Y, Juvik G, Roe T, Schroeder M, Weng S, Botstein D. SGD: Saccharomyces genome database. Nucleic Acids Res. 1998;26:73–79. - PMC - PubMed

Publication types

MeSH terms