

Loss of precursor B cell expansion but not allelic exclusion in VpreB1/VpreB2 double-deficient mice
- PMID: 11181696
- PMCID: PMC2195903
- DOI: 10.1084/jem.193.4.435
Loss of precursor B cell expansion but not allelic exclusion in VpreB1/VpreB2 double-deficient mice
Abstract
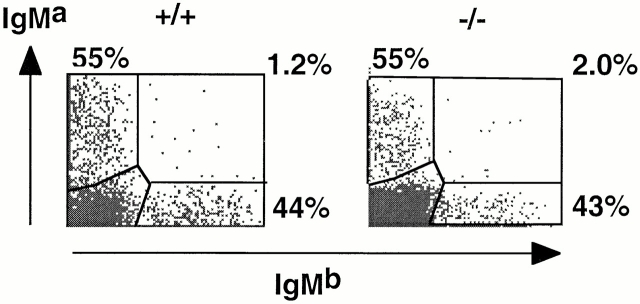
The pre-B cell receptor consists of immunoglobulin (Ig) mu heavy chains and surrogate light chain, i.e., the VpreB and lambda5 proteins. To analyze the role of the two VpreB proteins, mice lacking the VpreB1 and VpreB2 genes were generated. VpreB1(-/-) VpreB2(-/-) mice were impaired in their B cell development at the transition from pre-BI to large pre-BII cells. Pre-BII cells did not expand by proliferation, consequently 40-fold less small pre-BII and immature B cells were found in bone marrow, and the generation of immature and mature conventional B cells in spleen appeared reduced. In addition, only low numbers of B-1a cells were detected in the peritoneum. Surprisingly, Ig heavy chain allelic exclusion was still active, apparently ruling out a signaling role of a VpreB1/VpreB2-containing receptor in this process.
Figures


Similar articles
-
VpreB1/VpreB2/lambda 5 triple-deficient mice show impaired B cell development but functional allelic exclusion of the IgH locus.J Immunol. 2002 Jun 15;168(12):6286-93. doi: 10.4049/jimmunol.168.12.6286. J Immunol. 2002. PMID: 12055243
-
The murine VpreB1 and VpreB2 genes both encode a protein of the surrogate light chain and are co-expressed during B cell development.Eur J Immunol. 1996 Apr;26(4):906-13. doi: 10.1002/eji.1830260428. Eur J Immunol. 1996. PMID: 8625987
-
Only VpreB1, but not VpreB2, is expressed at levels which allow normal development of B cells.Int Immunol. 2006 Jan;18(1):163-72. doi: 10.1093/intimm/dxh359. Epub 2005 Dec 16. Int Immunol. 2006. PMID: 16361315
-
Repertoire selection by pre-B-cell receptors and B-cell receptors, and genetic control of B-cell development from immature to mature B cells.Immunol Rev. 2000 Jun;175:33-46. Immunol Rev. 2000. PMID: 10933589 Review.
-
The pre-B cell receptor and its role in proliferation and Ig heavy chain allelic exclusion.Semin Immunol. 2002 Oct;14(5):335-42. doi: 10.1016/s1044-5323(02)00066-0. Semin Immunol. 2002. PMID: 12220934 Review.
Cited by
-
New frontiers of primary antibody deficiencies.Cell Mol Life Sci. 2012 Jan;69(1):59-73. doi: 10.1007/s00018-011-0836-x. Epub 2011 Nov 1. Cell Mol Life Sci. 2012. PMID: 22042269 Free PMC article. Review.
-
The Sel1L-Hrd1 Endoplasmic Reticulum-Associated Degradation Complex Manages a Key Checkpoint in B Cell Development.Cell Rep. 2016 Sep 6;16(10):2630-2640. doi: 10.1016/j.celrep.2016.08.003. Epub 2016 Aug 25. Cell Rep. 2016. PMID: 27568564 Free PMC article.
-
Breaking the Paradigm: Selection of Self-Reactive Natural Antibodies.J Immunol. 2022 Nov 1;209(9):1621-1623. doi: 10.4049/jimmunol.2200406. J Immunol. 2022. PMID: 36253068 Free PMC article. No abstract available.
-
Generation of heavy-chain-only antibodies in mice.Proc Natl Acad Sci U S A. 2006 Oct 10;103(41):15130-5. doi: 10.1073/pnas.0601108103. Epub 2006 Oct 2. Proc Natl Acad Sci U S A. 2006. PMID: 17015837 Free PMC article.
-
Changes in histone acetylation are associated with differences in accessibility of V(H) gene segments to V-DJ recombination during B-cell ontogeny and development.Mol Cell Biol. 2003 Apr;23(7):2438-50. doi: 10.1128/MCB.23.7.2438-2450.2003. Mol Cell Biol. 2003. PMID: 12640127 Free PMC article.
References
-
- Rolink A., Grawunder U., Winkler T.H., Karasuyama H., Melchers F. IL-2 receptor alpha chain (CD25, TAC) expression defines a crucial stage in pre-B cell development. Int. Immunol. 1994;6:1257–1264. - PubMed
-
- Osmond D.G., Rolink A., Melchers F. Murine B lymphopoiesistowards a unified model. Immunol. Today. 1998;19:65–68. - PubMed
-
- Ehlich A., Martin V., Muller W., Rajewsky K. Analysis of the B cell progenitor compartment at the level of single cells. Curr. Biol. 1994;4:573–583. - PubMed
-
- ten Boekel E., Melchers F., Rolink A. The status of Ig loci rearrangements in single cells from different stages of B cell development. Int. Immunol. 1995;7:1013–1019. - PubMed
Publication types
MeSH terms
Substances
LinkOut - more resources
Full Text Sources
Other Literature Sources
Medical
Molecular Biology Databases
Research Materials
