. 2001 Feb 19;193(4):509-19.
doi: 10.1084/jem.193.4.509.

Control of mitochondrial membrane permeabilization by adenine nucleotide translocator interacting with HIV-1 viral protein rR and Bcl-2

Affiliations

Control of mitochondrial membrane permeabilization by adenine nucleotide translocator interacting with HIV-1 viral protein rR and Bcl-2

E Jacotot et al. J Exp Med. .

Abstract

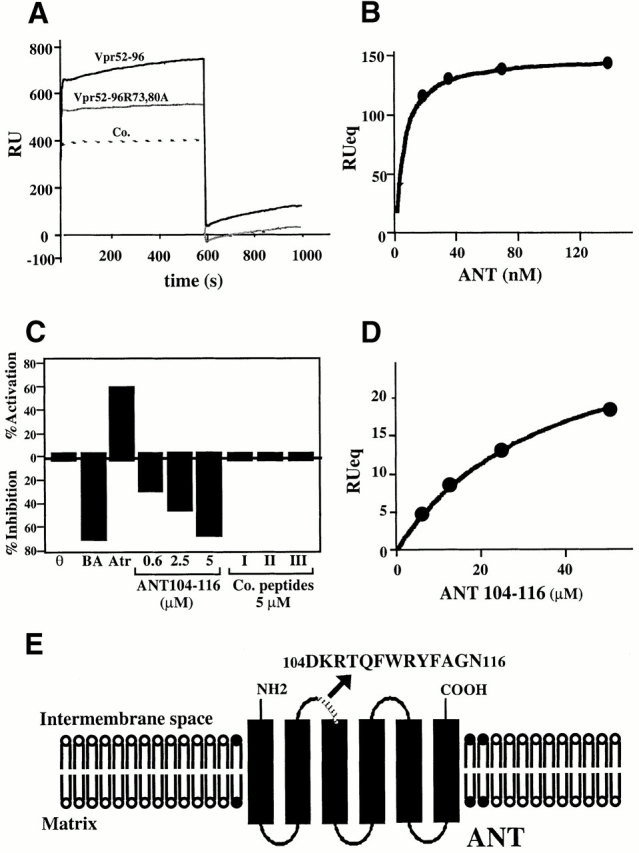
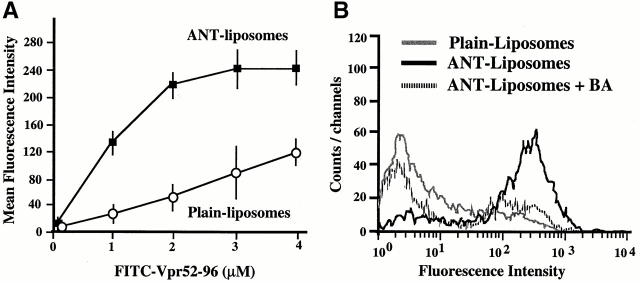
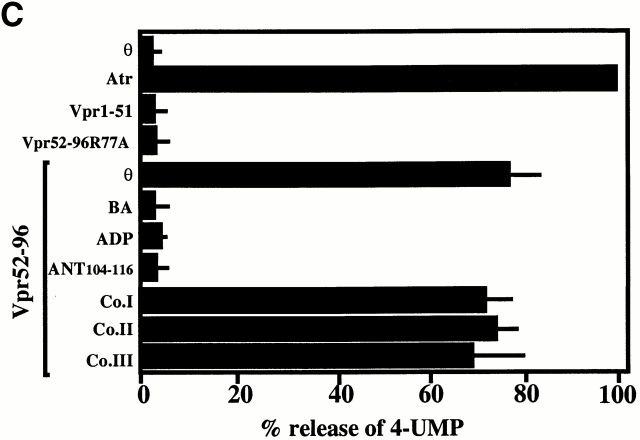
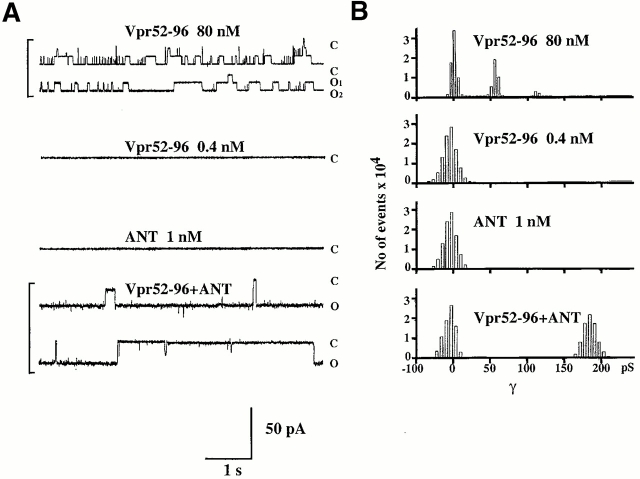
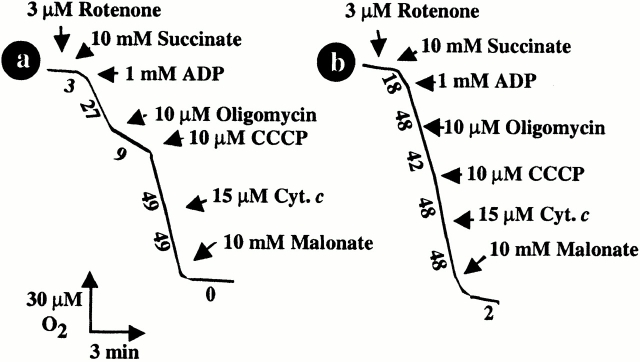
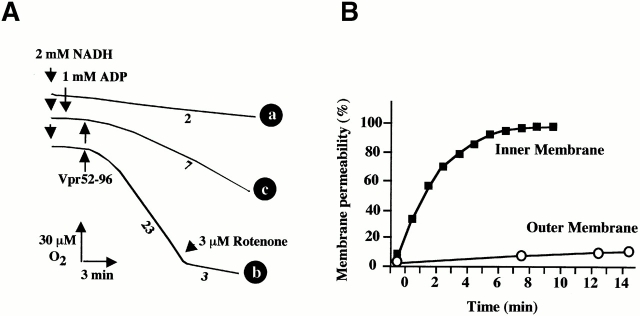
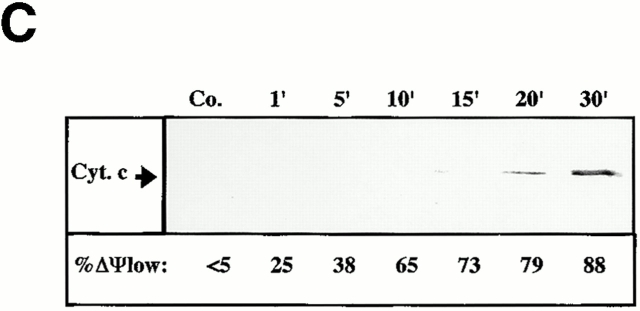
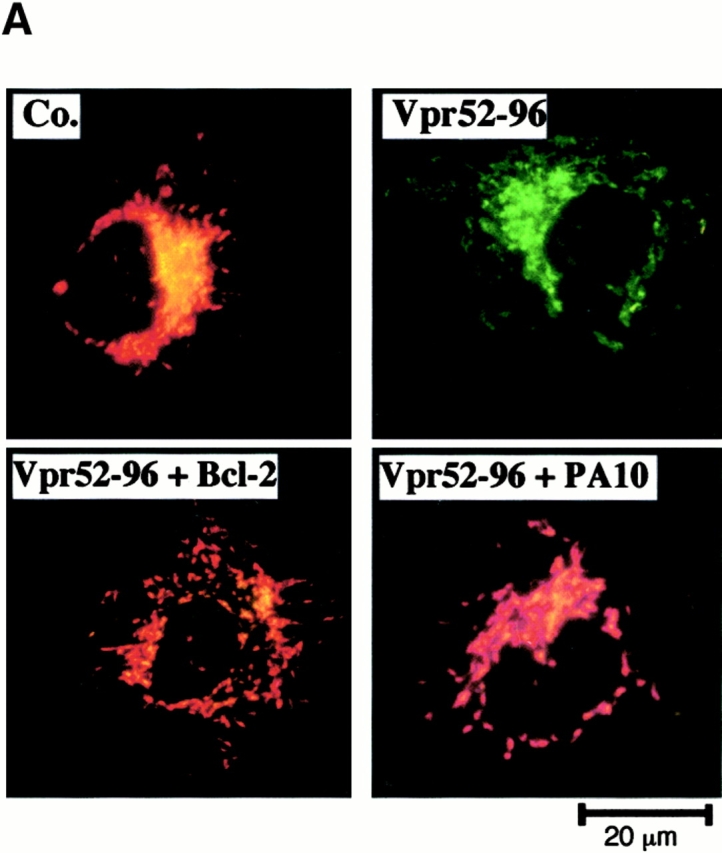
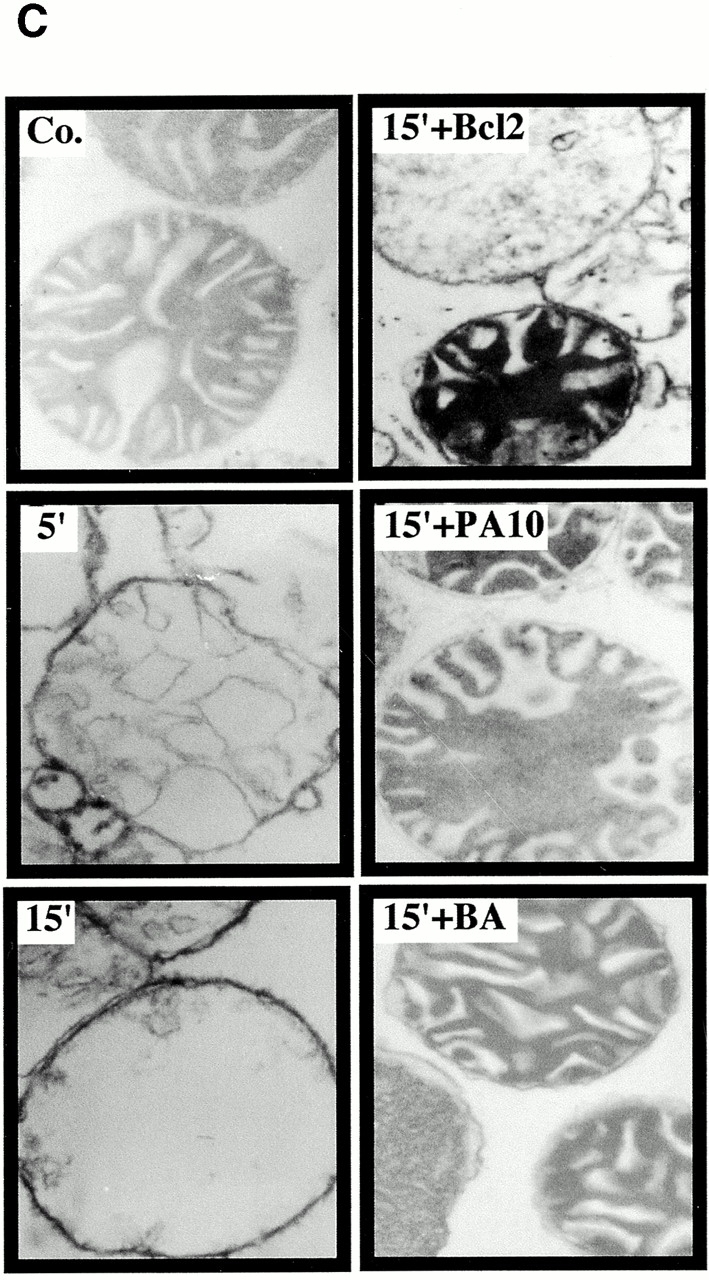
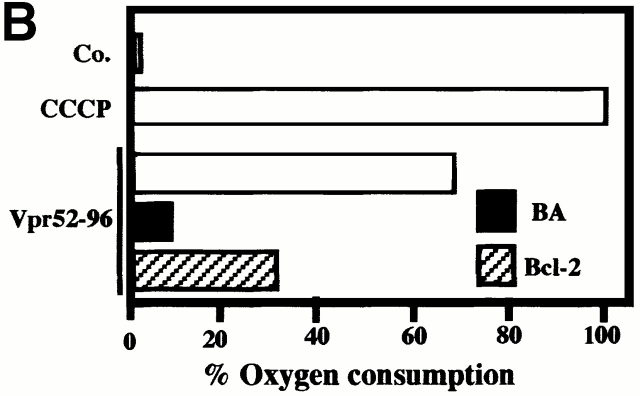
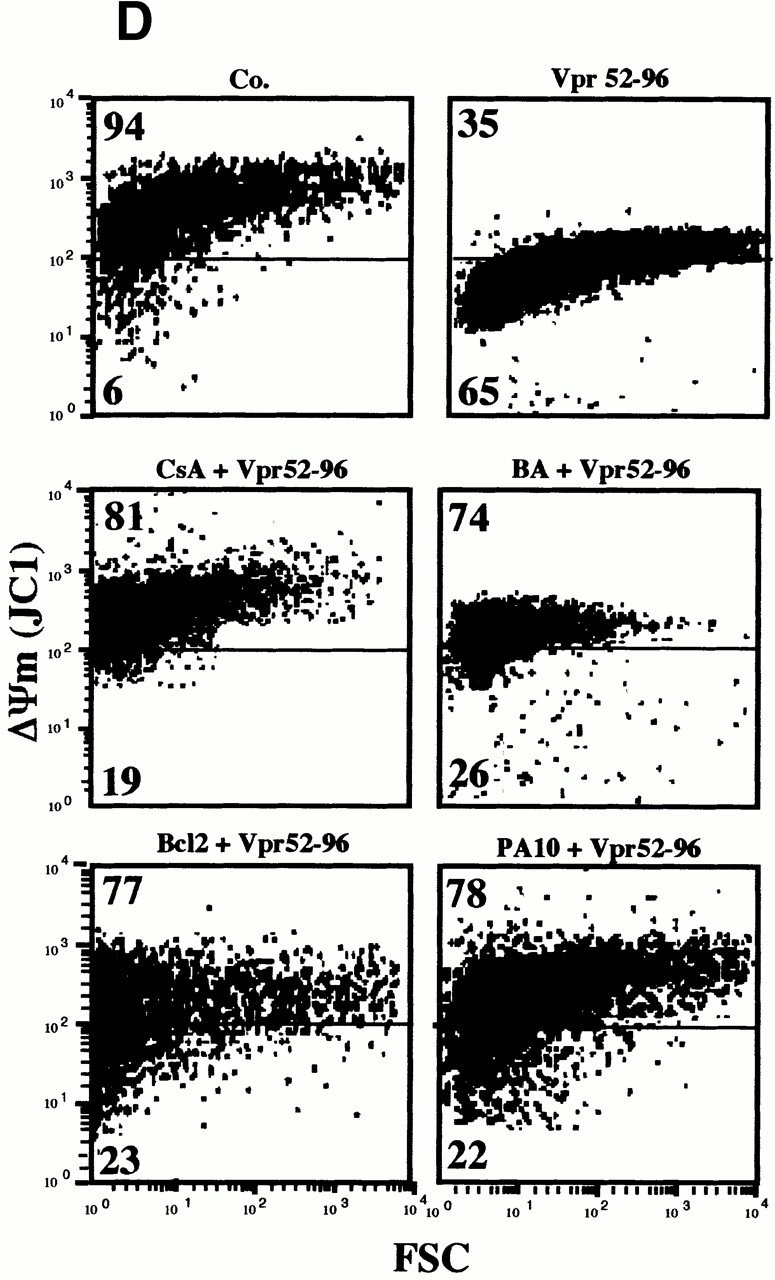
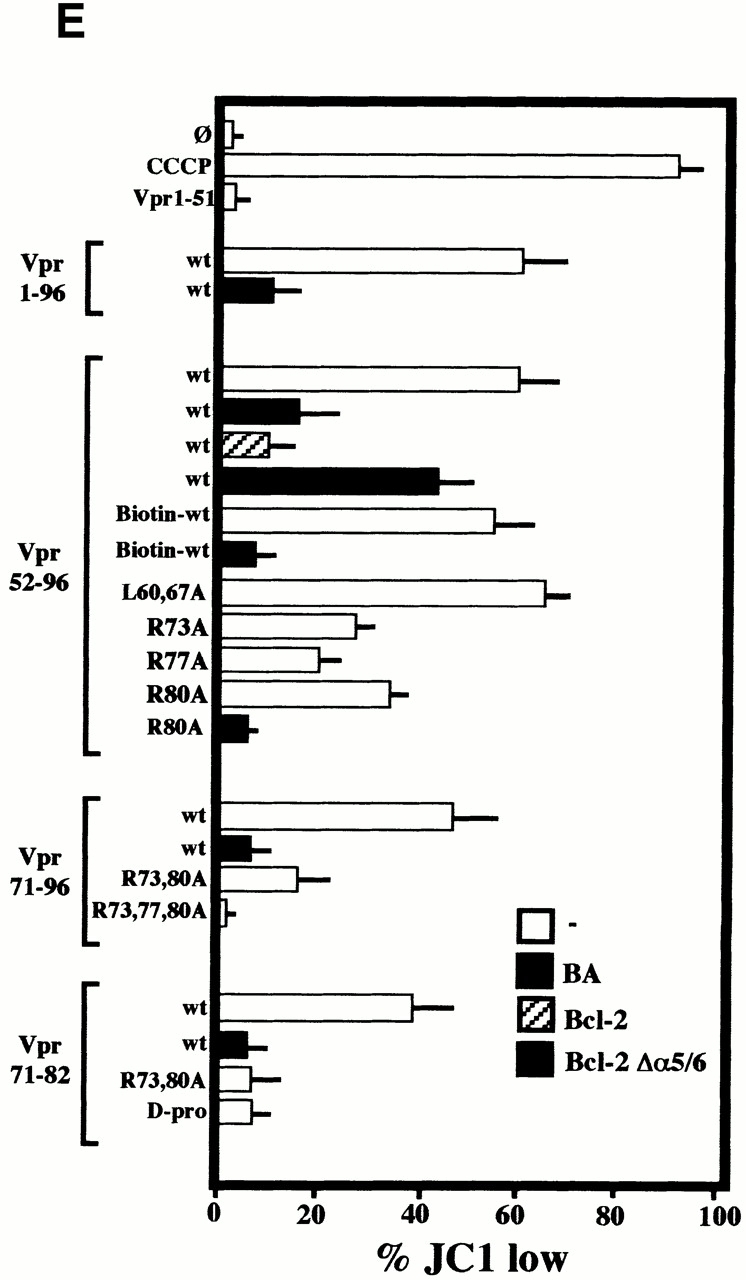
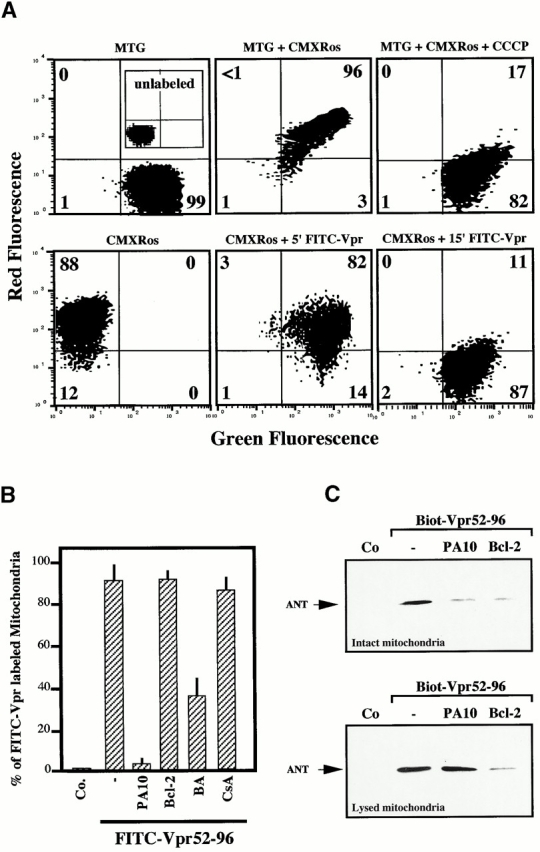
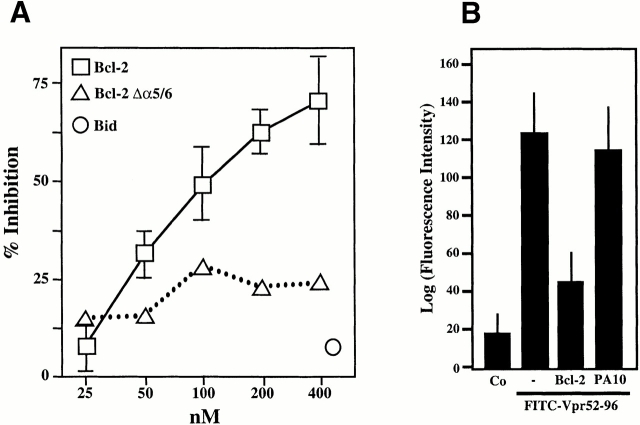
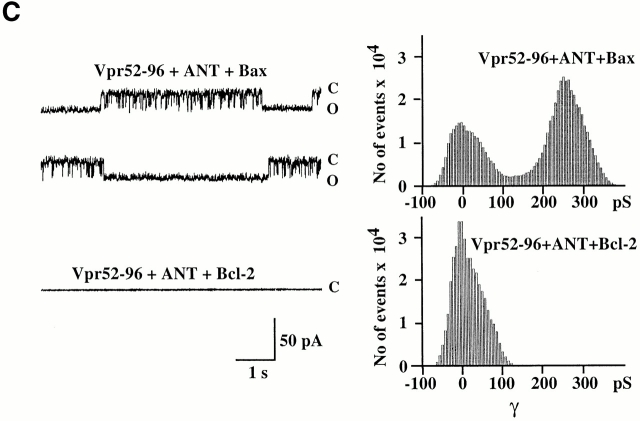
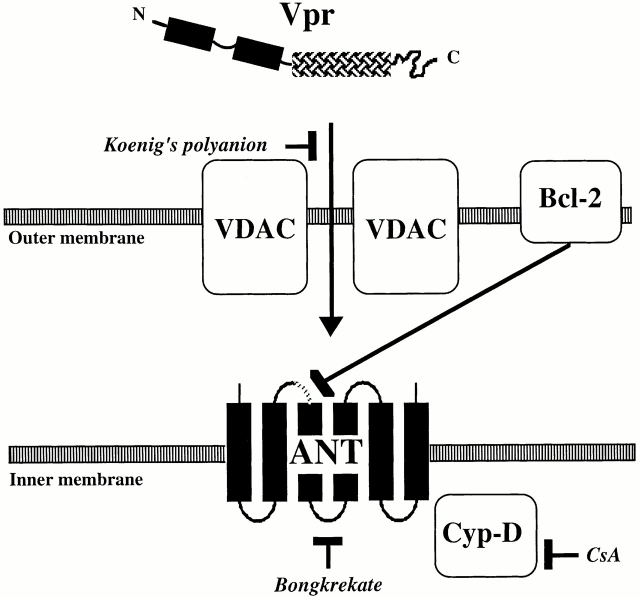
Viral protein R (Vpr), an apoptogenic accessory protein encoded by HIV-1, induces mitochondrial membrane permeabilization (MMP) via a specific interaction with the permeability transition pore complex, which comprises the voltage-dependent anion channel (VDAC) in the outer membrane (OM) and the adenine nucleotide translocator (ANT) in the inner membrane. Here, we demonstrate that a synthetic Vpr-derived peptide (Vpr52-96) specifically binds to the intermembrane face of the ANT with an affinity in the nanomolar range. Taking advantage of this specific interaction, we determined the role of ANT in the control of MMP. In planar lipid bilayers, Vpr52-96 and purified ANT cooperatively form large conductance channels. This cooperative channel formation relies on a direct protein-protein interaction since it is abolished by the addition of a peptide corresponding to the Vpr binding site of ANT. When added to isolated mitochondria, Vpr52-96 uncouples the respiratory chain and induces a rapid inner MMP to protons and NADH. This inner MMP precedes outer MMP to cytochrome c. Vpr52-96-induced matrix swelling and inner MMP both are prevented by preincubation of purified mitochondria with recombinant Bcl-2 protein. In contrast to König's polyanion (PA10), a specific inhibitor of the VDAC, Bcl-2 fails to prevent Vpr52-96 from crossing the mitochondrial OM. Rather, Bcl-2 reduces the ANT-Vpr interaction, as determined by affinity purification and plasmon resonance studies. Concomitantly, Bcl-2 suppresses channel formation by the ANT-Vpr complex in synthetic membranes. In conclusion, both Vpr and Bcl-2 modulate MMP through a direct interaction with ANT.


Figures

Figure 1
Figure 1
Physical and functional interaction between Vpr and ANT. (A) Plasmon surface resonance sensorgrams of the interaction of ANT with Vpr52-96, Vpr52-96[R73A,80A], or an irrelevant control (Co.). Only the sensorgram of the interaction with Vpr52-96 exhibits an increase of binding as a function of time and a positive signal at the start of the dissociation phase (off). The calculated K D (K D= k on/k off) of the interaction is 9.7 ± 6.4 nM (X ± SD, n = 5). (B) Langmuir isotherm determined at different concentrations of ANT on sensorgrams corrected by substraction of the blank (sensorgrams obtained with Vpr52-96[R73A,80A]). (C) Modulation of the Vpr52-96–ANT interaction by ANT ligands and ANT-derived peptides. Measurements were performed as in A, in the absence (θ) or presence of BA (250 μM), Atr (50 μM), the ANT104-116 peptide, or three control peptides (all at 5 μM). ANT-2–derived peptide ANT104-116 (DKRTQFWRYFAGN) and control peptides (Co.I: scrambled ANT104-116 [FQNYWGHKRFRDA]; Co.II: mutated ANT104-116 [DGHKQFWGYFAGN]; Co.III: topologically equivalent peptide [amino acids 149–161]) from the ANT-related human phosphate carrier protein (SNMLGEENTYLWR). Activation or inhibition was calculated as (1 − k 0a/k 0) × 100, in which k 0a and k 0 are the initial velocity in the presence or absence of the agent, respectively. (D) Langmuir isotherm for the binding of ANT104-116 to biotinylated Vpr52-96 (as determined in A). The calculated K D of the interaction is 35 μM. (E) Schematic diagram showing the topology of ANT and the sequence of the ANT-2–derived peptide ANT104-116.
Figure 2
Figure 2
Physical (A and B) and functional (C) interaction between Vpr and liposomes containing ANT. (A) Dose–response curve of FITC-labeled Vpr52-96 binding on ANT liposomes and plain liposomes. (B) Binding of FITC–Vpr52-96 (2 μM) to plain liposomes, ANT proteoliposomes, in the presence or absence of BA (50 μM). (C) Permeabilization of ANT proteoliposomes by Vpr (X ± SD, n = 3). Liposomes were loaded with 4-MUP and exposed for 60 min to Atr (200 μM) or the indicated Vpr-derived peptides (1 μM), in the presence or absence of BA (50 μM), ADP (800 μM), and/or the indicated peptides (same as in B, 0.5 μM, preincubated with Vpr52-96 for 5 min). Then, alkaline phosphatase was added to convert liposome-released 4-MUP into the fluorochrome 4-MU, and the percentage of 4-MUP release induced by Vpr-derived peptides was calculated as described in Materials and Methods.
Figure 2
Figure 2
Physical (A and B) and functional (C) interaction between Vpr and liposomes containing ANT. (A) Dose–response curve of FITC-labeled Vpr52-96 binding on ANT liposomes and plain liposomes. (B) Binding of FITC–Vpr52-96 (2 μM) to plain liposomes, ANT proteoliposomes, in the presence or absence of BA (50 μM). (C) Permeabilization of ANT proteoliposomes by Vpr (X ± SD, n = 3). Liposomes were loaded with 4-MUP and exposed for 60 min to Atr (200 μM) or the indicated Vpr-derived peptides (1 μM), in the presence or absence of BA (50 μM), ADP (800 μM), and/or the indicated peptides (same as in B, 0.5 μM, preincubated with Vpr52-96 for 5 min). Then, alkaline phosphatase was added to convert liposome-released 4-MUP into the fluorochrome 4-MU, and the percentage of 4-MUP release induced by Vpr-derived peptides was calculated as described in Materials and Methods.
Figure 3
Figure 3
Electrophysiological properties of Vpr52-96 and ANT in planar lipid bilayers. Current fluctuations of Vpr52-96 (80 nM, +150 mV), Vpr52-96 (0.4 nM, +100 mV), ANT (1 nM, +110 mV), and Vpr52-96 plus ANT (0.4:1 nM, +115 mV), and associated histograms (right) of conductance levels are shown. (A) Cooperative effect between ANT and Vpr52-96 at the single channel level. Current fluctuations of Vpr52-96 (80 nM, +150 mV), Vpr52-96 (0.4 nM, +100 mV), ANT (1 nM, +110 mV), and Vpr52-96 plus ANT (0.4:1 nM, +115 mV) after incorporation into synthetic membranes. Single channel recordings were performed using the tip-dip technique. The recordings shown are representative of at least three independent determinations. (B) Statistical analysis of conductances obtained in A. Results were expressed as current distributions at different voltages. Conductances (γ; in pS) are calculated by division of current by voltage.
Figure 4
Figure 4
Oxidative properties of purified mitochondria exposed to Vpr. Oxygen consumption curves after addition of the indicated agents. Trace a: control mitochondria (no pretreatment). Trace b: mitochondria pretreated for 10 min with 1 μM Vpr52-96. Numbers along the traces are nanomoles of O2 consumed per minute per milligram of protein.
Figure 5
Figure 5
Inner versus outer MMP. (A) Respirometry performed after addition of NADH and Vpr52-96 (1 μM). Numbers along the traces are nmol of O2 consumed per minute per milligram protein. Note that the Vpr-stimulated, NADH-dependent O2 consumption was fully sensitive to rotenone. (B) Kinetics of Vpr52-96–induced IM permeabilization to NADH and OM permeabilization to reduced cytochrome c. Oxygen consumption was determined in the presence of 2 mM NADH (▪) as in A (trace c) and cytochrome c (15 μM) oxidation (○) was spectrofluorometrically measured, as described (reference 34). The 100% value of cytochrome c oxidation was determined by addition of 2.5 mM laurylmaltoside. (C) Kinetics of Vpr52-96–induced ΔΨm loss and cytochrome c release. Purified mitochondria were treated with 1 μM Vpr52-96 subjected to cytofluorometric determination of the percentage of mitochondria having a low ΔΨm using the ΔΨm-sensitive fluorochrome JC-1. In parallel, cytochrome c was immunodetected in the supernatant of mitochondria.
Figure 5
Figure 5
Inner versus outer MMP. (A) Respirometry performed after addition of NADH and Vpr52-96 (1 μM). Numbers along the traces are nmol of O2 consumed per minute per milligram protein. Note that the Vpr-stimulated, NADH-dependent O2 consumption was fully sensitive to rotenone. (B) Kinetics of Vpr52-96–induced IM permeabilization to NADH and OM permeabilization to reduced cytochrome c. Oxygen consumption was determined in the presence of 2 mM NADH (▪) as in A (trace c) and cytochrome c (15 μM) oxidation (○) was spectrofluorometrically measured, as described (reference 34). The 100% value of cytochrome c oxidation was determined by addition of 2.5 mM laurylmaltoside. (C) Kinetics of Vpr52-96–induced ΔΨm loss and cytochrome c release. Purified mitochondria were treated with 1 μM Vpr52-96 subjected to cytofluorometric determination of the percentage of mitochondria having a low ΔΨm using the ΔΨm-sensitive fluorochrome JC-1. In parallel, cytochrome c was immunodetected in the supernatant of mitochondria.
Figure 6
Figure 6
Bcl-2–mediated inhibition of Vpr effects on mitochondria. (A) Vpr52-96–induced ΔΨm dissipation induced in intact cells. COS cells were microinjected with 10 μM recombinant human Bcl-2, 2 μM PA10, or PBS only, then incubated in the absence (Co.) or presence of 1 μM Vpr52-96 for 3 h, and stained with 2 μM ΔΨm-sensitive dye JC-1 (red fluorescence shows mitochondria with a high ΔΨm, green fluorescence shows mitochondria with a low ΔΨm). (B) Effect of Bcl-2 on the Vpr-induced inner MMP to NADH. Mitochondria were left untreated (Co.) or were pretreated (10 min) with Bcl-2 (0.8 μM) or BA (10 μM). Oxygen consumption of purified mitochondria was measured as in the legend to Fig. 5 after addition of succinate plus CCCP or NADH, as indicated. (C) Ultrastructural effects of Vpr on isolated mitochondria. Electron micrographs were obtained after incubation of mitochondria for 5 or 15 min with 3 μM Vpr52-96, after a 5-min preincubation with 0.8 μM Bcl-2 or 2 μM PA10. The percentage of swollen mitochondria was <5% in the control, 82 ± 4% (n = 3, X ± SEM) 5 min after Vpr addition, 99 ± 1% 15 min after Vpr, 52 ± 4% after treatment with Bcl-2 plus 15 min Vpr, and 24 ± 3% after treatment with BA plus 15 min Vpr. (D) Effect of Bcl-2 and PA10 on Vpr52-96–induced ΔΨm dissipation in purified mitochondria. Isolated mitochondria (200 μg protein/ml) were preincubated with the indicated inhibitors (5 μM CsA, 50 μM BA, 0.8 μM Bcl-2, 2 μM PA10; 5–10 min), washed (10 min, 6,800 g, 20°C), incubated with the ΔΨm-sensitive dye JC-1 (200 nM for 10 min), exposed to 3 μM Vpr52-96 for 5 min, and subjected to flow cytometric determination of the fluorescence (570–595 nm) and the particle size (FSC). Numbers indicate the percentage of JC-1high and JC-1low mitochondria among ∼104 events. (E) Quantitation of the frequency of JC-1low mitochondria (X ± SD, n = 5) after incubation with different Vpr-derived peptides. Purified mitochondria were preincubated 10 min with or without 0.8 μM Bcl-2, 0.8 μM Bcl-2Δα5/6, or 10 μM BA in PT buffer, incubated with the ΔΨm-sensitive dye JC-1 (200 nM for 10 min), and then treated for 5 min with 3 μM Vpr52-96 (wild-type [wt], biotinylated, or modified as indicated), or 10 min with 5–10 μM Vpr1-96, Vpr1-51, Vpr71-96, Vpr71-82 (wild-type or modified as indicated), and finally subjected to flow cytometric analysis as in D.
Figure 6
Figure 6
Bcl-2–mediated inhibition of Vpr effects on mitochondria. (A) Vpr52-96–induced ΔΨm dissipation induced in intact cells. COS cells were microinjected with 10 μM recombinant human Bcl-2, 2 μM PA10, or PBS only, then incubated in the absence (Co.) or presence of 1 μM Vpr52-96 for 3 h, and stained with 2 μM ΔΨm-sensitive dye JC-1 (red fluorescence shows mitochondria with a high ΔΨm, green fluorescence shows mitochondria with a low ΔΨm). (B) Effect of Bcl-2 on the Vpr-induced inner MMP to NADH. Mitochondria were left untreated (Co.) or were pretreated (10 min) with Bcl-2 (0.8 μM) or BA (10 μM). Oxygen consumption of purified mitochondria was measured as in the legend to Fig. 5 after addition of succinate plus CCCP or NADH, as indicated. (C) Ultrastructural effects of Vpr on isolated mitochondria. Electron micrographs were obtained after incubation of mitochondria for 5 or 15 min with 3 μM Vpr52-96, after a 5-min preincubation with 0.8 μM Bcl-2 or 2 μM PA10. The percentage of swollen mitochondria was <5% in the control, 82 ± 4% (n = 3, X ± SEM) 5 min after Vpr addition, 99 ± 1% 15 min after Vpr, 52 ± 4% after treatment with Bcl-2 plus 15 min Vpr, and 24 ± 3% after treatment with BA plus 15 min Vpr. (D) Effect of Bcl-2 and PA10 on Vpr52-96–induced ΔΨm dissipation in purified mitochondria. Isolated mitochondria (200 μg protein/ml) were preincubated with the indicated inhibitors (5 μM CsA, 50 μM BA, 0.8 μM Bcl-2, 2 μM PA10; 5–10 min), washed (10 min, 6,800 g, 20°C), incubated with the ΔΨm-sensitive dye JC-1 (200 nM for 10 min), exposed to 3 μM Vpr52-96 for 5 min, and subjected to flow cytometric determination of the fluorescence (570–595 nm) and the particle size (FSC). Numbers indicate the percentage of JC-1high and JC-1low mitochondria among ∼104 events. (E) Quantitation of the frequency of JC-1low mitochondria (X ± SD, n = 5) after incubation with different Vpr-derived peptides. Purified mitochondria were preincubated 10 min with or without 0.8 μM Bcl-2, 0.8 μM Bcl-2Δα5/6, or 10 μM BA in PT buffer, incubated with the ΔΨm-sensitive dye JC-1 (200 nM for 10 min), and then treated for 5 min with 3 μM Vpr52-96 (wild-type [wt], biotinylated, or modified as indicated), or 10 min with 5–10 μM Vpr1-96, Vpr1-51, Vpr71-96, Vpr71-82 (wild-type or modified as indicated), and finally subjected to flow cytometric analysis as in D.
Figure 7
Figure 7
Differential effect of Bcl-2 and PA10 on Vpr52-96 binding to mitochondria. (A) Vpr52-96 binds mitochondria before inducing ΔΨm loss. Mitochondria were left unstained (inset in control, top left panel) or exposed to the ΔΨm-insensitive mitochondrial dye MitoTracker® Green (75 nM), alone (MTG) or with 0.5 μM FITC–Vpr52-96 (green fluorescence) in combination with the ΔΨm-sensitive mitochondrial dye MitoTracker® Red (chloromethyl-X-rosamine; red fluorescence) followed by cytofluorometric two-color analysis. Numbers indicate the percentage of mitochondria in each quadrant. (B) PA10, but not Bcl-2, inhibits Vpr52-96 binding to mitochondria. Mitochondria were preincubated for 10 min with the indicated inhibitors, and the percentage of FITC–Vpr52-96–labeled mitochondria was determined as in A. (C) Inhibitory effect of Bcl-2 on affinity purification of ANT by biotinylated Vpr52-96. Mitochondria were incubated with the indicated inhibitors, and then exposed for 30 min at RT with 5 μM biotinylated Vpr52-96. Mitochondria were lysed either after incubation with biotinylated Vpr52-96 (top) or lysed before (bottom) with Tris-HCl as described in Materials and Methods. Biotinylated Vpr52-96 complexed with its mitochondrial ligands was retained on avidin-agarose and subjected to immunoblot detection of ANT. Co, control.
Figure 8
Figure 8
Bcl-2–mediated inhibition of the Vpr–ANT interaction. (A) Plasmon surface resonance determination of the Bcl-2–mediated inhibition of interaction between Vpr52-96 and native purified ANT. The interaction was measured after the addition of the indicated concentrations of recombinant Bcl-2, Bcl-2Δα5/6, or recombinant Bid, and data (X ± SD, n = 3) were calculated as in the legend to Fig. 1. (B) Effect of Bcl-2 on Vpr binding to ANT proteoliposomes. The retention (X ± SD, n = 3) of FITC-labeled Vpr52-96 on ANT proteoliposomes preincubated with 800 nM Bcl-2 or 2 μM PA10 (followed by washing) was assessed as in the legend to Fig. 2 A. Co, control. (C) Effect of Bcl-2 on the formation of Vpr–ANT channels in planar lipid bilayers. Single channel recordings (+75 mV) of Vpr52-96 plus ANT plus Bax (0.4:1:0.3 nM) and Vpr52-96 plus ANT plus Bcl-2 (0.4:1:1 nM), and corresponding amplitude histograms are displayed. Control values for Vpr52-96 plus ANT alone are similar as in Fig. 1 E (data not shown). C, closed; O, open.
Figure 8
Figure 8
Bcl-2–mediated inhibition of the Vpr–ANT interaction. (A) Plasmon surface resonance determination of the Bcl-2–mediated inhibition of interaction between Vpr52-96 and native purified ANT. The interaction was measured after the addition of the indicated concentrations of recombinant Bcl-2, Bcl-2Δα5/6, or recombinant Bid, and data (X ± SD, n = 3) were calculated as in the legend to Fig. 1. (B) Effect of Bcl-2 on Vpr binding to ANT proteoliposomes. The retention (X ± SD, n = 3) of FITC-labeled Vpr52-96 on ANT proteoliposomes preincubated with 800 nM Bcl-2 or 2 μM PA10 (followed by washing) was assessed as in the legend to Fig. 2 A. Co, control. (C) Effect of Bcl-2 on the formation of Vpr–ANT channels in planar lipid bilayers. Single channel recordings (+75 mV) of Vpr52-96 plus ANT plus Bax (0.4:1:0.3 nM) and Vpr52-96 plus ANT plus Bcl-2 (0.4:1:1 nM), and corresponding amplitude histograms are displayed. Control values for Vpr52-96 plus ANT alone are similar as in Fig. 1 E (data not shown). C, closed; O, open.
Figure 9
Figure 9
Model of the Vpr–PTPC interactions. Vpr crosses the OM through VDAC, which is inhibited by PA10. Vpr then interacts with ANT. Bcl-2 and the ANT ligand BA (Bongkrekate) inhibit the binding of Vpr to ANT, whereas CsA indirectly affects the pore forming function of ANT via its effect on cyclophilin D (Cyp-D).

Comment in

References

    1. Kroemer G., Zamzami N., Susin S.A. Mitochondrial control of apoptosis. Immunol. Today. 1997;18:44–51. - PubMed
    1. Green D.R., Reed J.C. Mitochondria and apoptosis. Science. 1998;281:1309–1312. - PubMed
    1. Lemasters J.J., Nieminen A.-L., Qjan T., Trost L.C., Elmore S.P., Nishimura Y., Crowe R.A., Cascio W.E., Bradham C.A., Brenner D.A., Herman B. The mitochondrial permeability transition in cell deatha common mechanism in necrosis, apoptosis and autophagy. Biochim. Biophys. Acta. 1998;1366:177–196. - PubMed
    1. Wallace D.C. Mitochondrial diseases in mouse and man. Science. 1999;283:1482–1488. - PubMed
    1. Vander Heiden M.G., Thompson C.B. Bcl-2 proteinsinhibitors of apoptosis or regulators of mitochondrial homeostasis? Nat. Cell Biol. 1999;1:E209–E216. - PubMed

Publication types