. 2001 Feb 19;193(4):531-43.
doi: 10.1084/jem.193.4.531.

BCL-2 cooperates with promyelocytic leukemia retinoic acid receptor alpha chimeric protein (PMLRARalpha) to block neutrophil differentiation and initiate acute leukemia

Affiliations

BCL-2 cooperates with promyelocytic leukemia retinoic acid receptor alpha chimeric protein (PMLRARalpha) to block neutrophil differentiation and initiate acute leukemia

S C Kogan et al. J Exp Med. .

Abstract

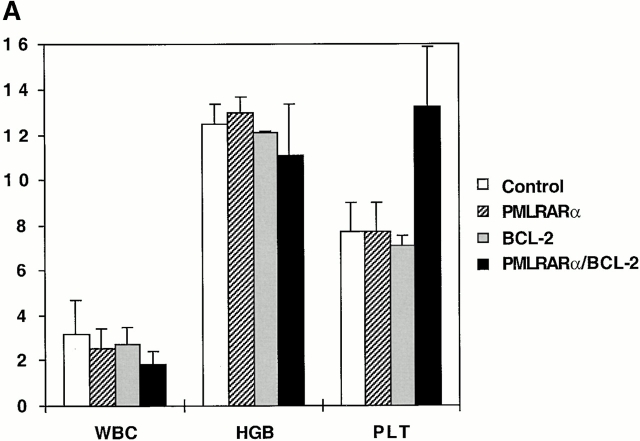
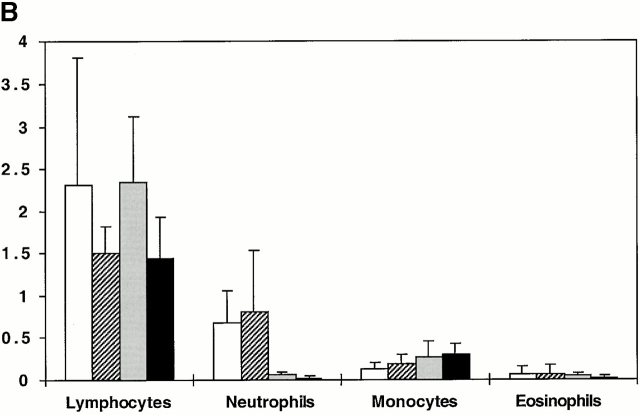
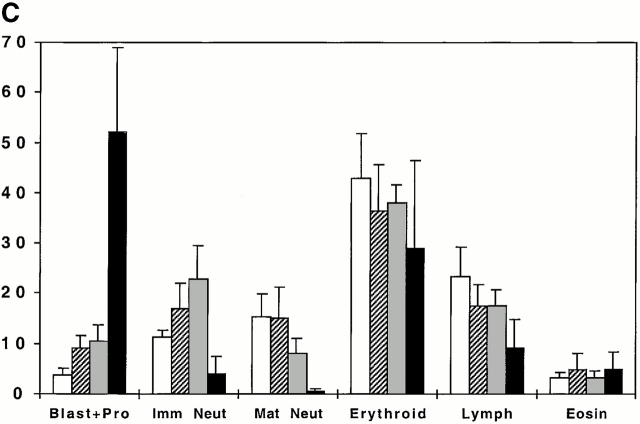
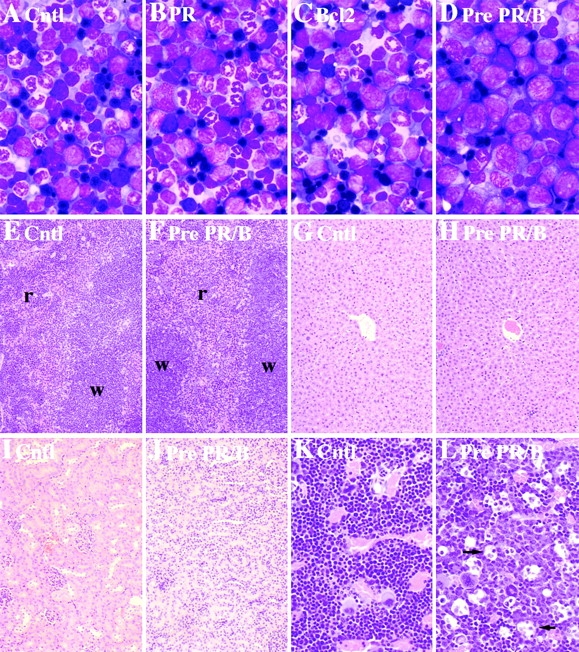
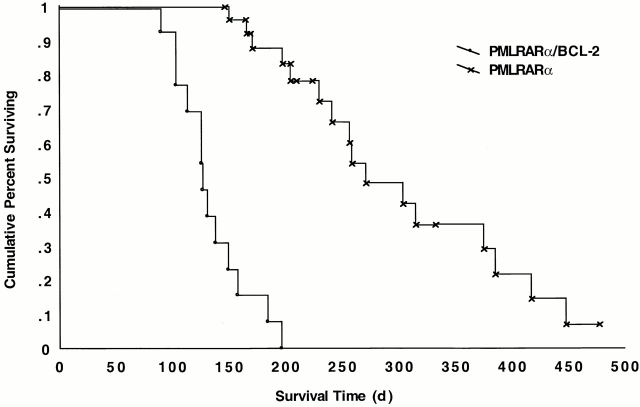
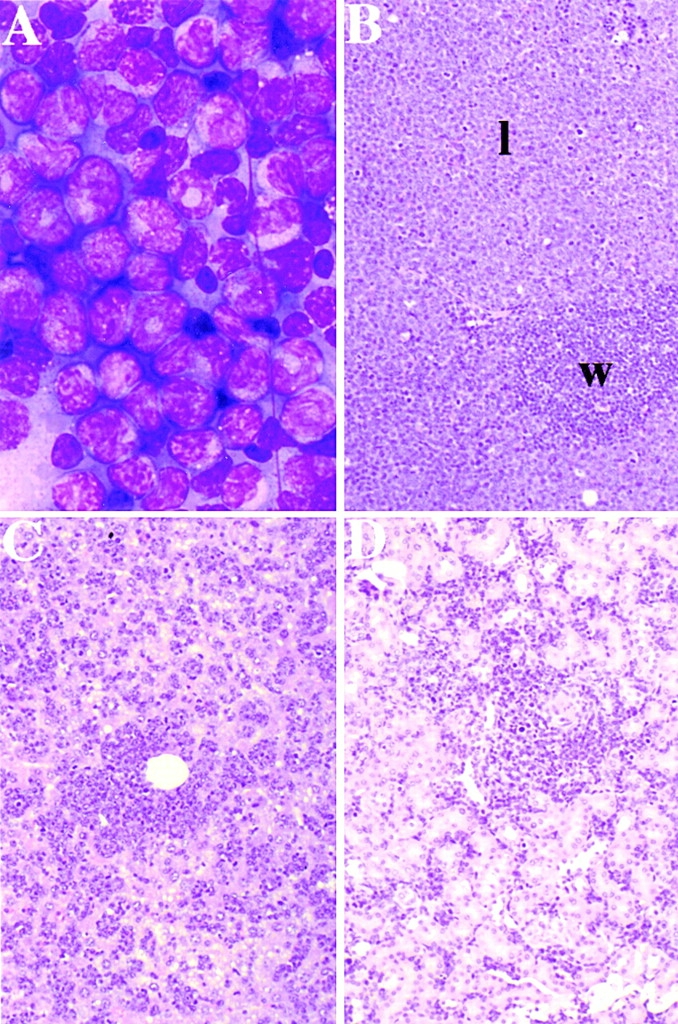
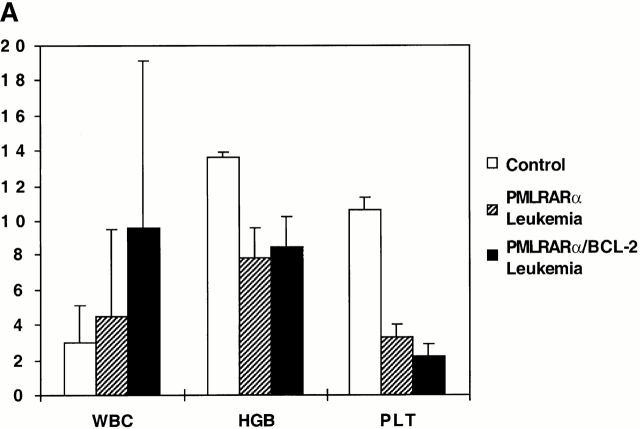
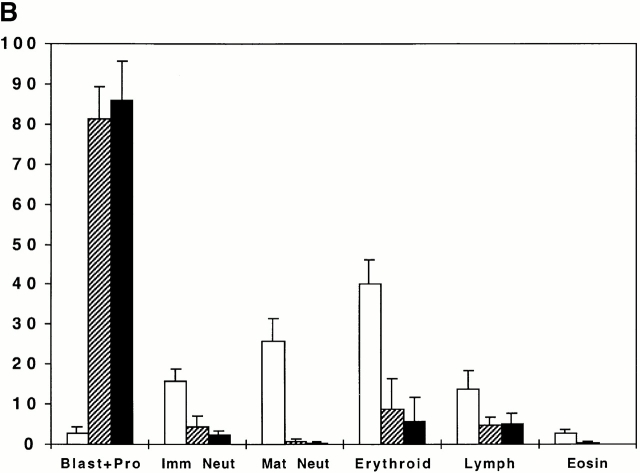
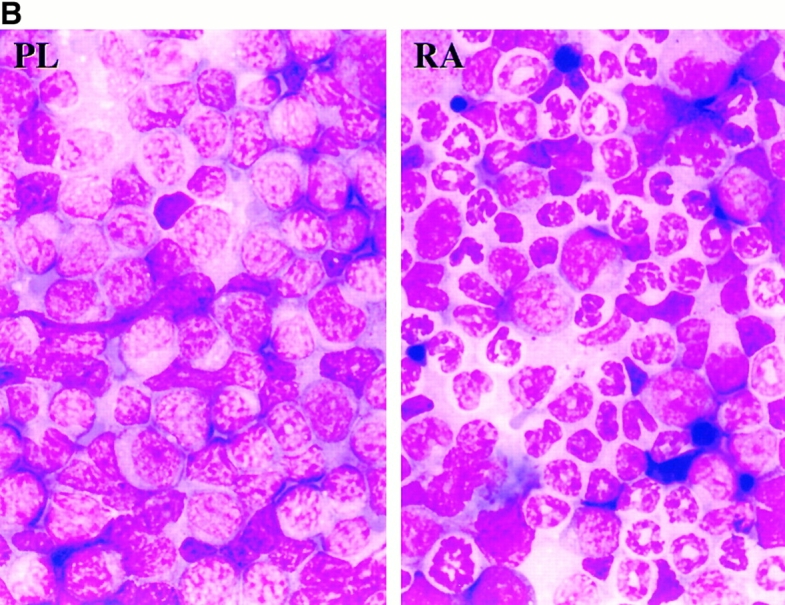
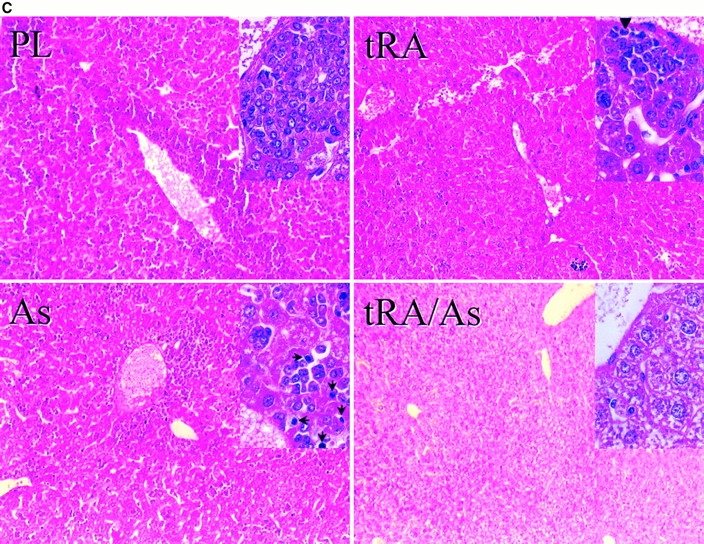
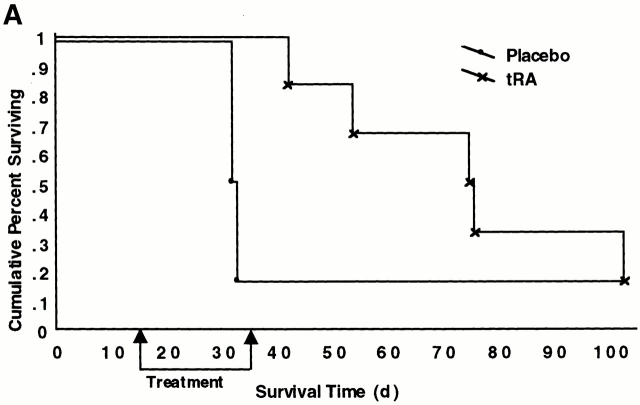
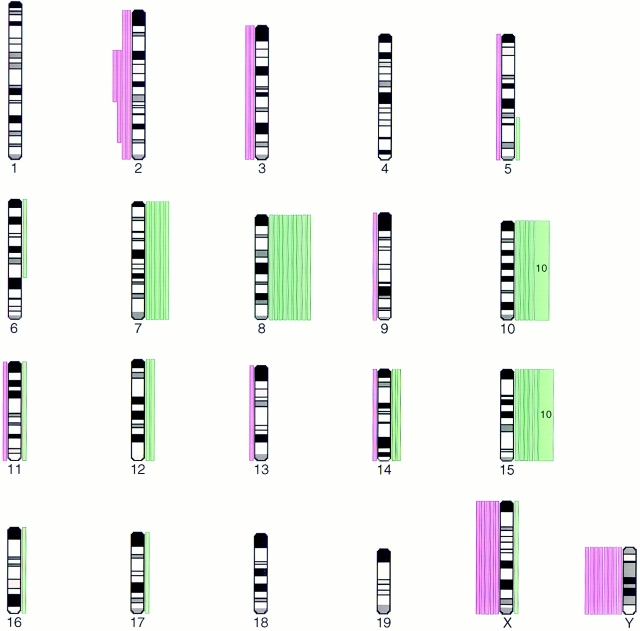
The promyelocytic leukemia retinoic acid receptor alpha (PMLRARalpha) chimeric protein is associated with acute promyelocytic leukemia (APL). PMLRARalpha transgenic mice develop leukemia only after several months, suggesting that PMLRARalpha does not by itself confer a fully malignant phenotype. Suppression of apoptosis can have a central role in tumorigenesis; therefore, we assessed whether BCL-2 influenced the ability of PMLRARalpha to initiate leukemia. Evaluation of preleukemic animals showed that whereas PMLRARalpha alone modestly altered neutrophil maturation, the combination of PMLRARalpha and BCL-2 caused a marked accumulation of immature myeloid cells in bone marrow. Leukemias developed more rapidly in mice coexpressing PMLRARalpha and BCL-2 than in mice expressing PMLRARalpha alone, and all mice expressing both transgenes succumbed to leukemia by 7 mo. Although both preleukemic, doubly transgenic mice and leukemic animals had abundant promyelocytes in the bone marrow, only leukemic mice exhibited thrombocytopenia and dissemination of immature cells. Recurrent gain of chromosomes 7, 8, 10, and 15 and recurrent loss of chromosome 2 were identified in the leukemias. These chromosomal changes may be responsible for the suppression of normal hematopoiesis and dissemination characteristic of the acute leukemias. Our results indicate that genetic changes that inhibit apoptosis can cooperate with PMLRARalpha to initiate APL.


Figures

Figure 1
Figure 1
BCL-2 cooperates with PMLRARα to impair neutrophil production in vivo. (A) Peripheral blood. White blood cell count (WBC, 1,000/μL), hemoglobin (HGB, g/dL), and platelet count (PLT, 100,000/μL) are shown. Littermate controls, n = 6; PMLRARα, n = 5; BCL-2, n = 4; and PMLRARα/BCL-2, n = 6. Platelet count was increased in PMLRARα/BCL-2 mice (P = 0.002). (B) Peripheral blood. Absolute cell counts (1,000/μL). Littermate controls, n = 6; PMLRARα, n = 4; BCL-2, n = 4; and PMLRARα/BCL-2, n = 6. Neutrophils were decreased in BCL-2 and PMLRARα/BCL-2 mice (P = 0.01). Monocytes were increased in PMLRARα/BCL-2 mice (P = 0.02). (C) Bone marrow. Percentages of nucleated cells were derived from 400 cell differential counts of Wright's Giemsa-stained bone marrow smears. Blast+Pro, blasts and promyelocytes; Imm Neut, neutrophilic myelocytes and metamyelocytes; Mat Neut, neutrophilic band, mature ring, and polymorphonuclear forms; Lymph, lymphocytes; Eosin, eosinophils. Littermate controls, n = 6; PMLRARα, n = 4; BCL-2, n = 4; PMLRARα/BCL-2, n = 6. In PMLRARα mice, blasts plus promyelocytes were increased (P = 0.01). In BCL-2 mice, blasts plus promyelocytes were increased (P = 0.02), immature neutrophils were increased (P = 0.04), and mature neutrophils were decreased (P = 0.02). In PMLRARα/BCL-2 mice, blasts plus promyelocytes were increased (P = 0.001), immature neutrophils were decreased (P = 0.003), mature neutrophils were decreased (P = 0.0004), and lymphocytes were decreased (P = 0.002). Graphs depict arithmetic means ± SD.
Figure 1
Figure 1
BCL-2 cooperates with PMLRARα to impair neutrophil production in vivo. (A) Peripheral blood. White blood cell count (WBC, 1,000/μL), hemoglobin (HGB, g/dL), and platelet count (PLT, 100,000/μL) are shown. Littermate controls, n = 6; PMLRARα, n = 5; BCL-2, n = 4; and PMLRARα/BCL-2, n = 6. Platelet count was increased in PMLRARα/BCL-2 mice (P = 0.002). (B) Peripheral blood. Absolute cell counts (1,000/μL). Littermate controls, n = 6; PMLRARα, n = 4; BCL-2, n = 4; and PMLRARα/BCL-2, n = 6. Neutrophils were decreased in BCL-2 and PMLRARα/BCL-2 mice (P = 0.01). Monocytes were increased in PMLRARα/BCL-2 mice (P = 0.02). (C) Bone marrow. Percentages of nucleated cells were derived from 400 cell differential counts of Wright's Giemsa-stained bone marrow smears. Blast+Pro, blasts and promyelocytes; Imm Neut, neutrophilic myelocytes and metamyelocytes; Mat Neut, neutrophilic band, mature ring, and polymorphonuclear forms; Lymph, lymphocytes; Eosin, eosinophils. Littermate controls, n = 6; PMLRARα, n = 4; BCL-2, n = 4; PMLRARα/BCL-2, n = 6. In PMLRARα mice, blasts plus promyelocytes were increased (P = 0.01). In BCL-2 mice, blasts plus promyelocytes were increased (P = 0.02), immature neutrophils were increased (P = 0.04), and mature neutrophils were decreased (P = 0.02). In PMLRARα/BCL-2 mice, blasts plus promyelocytes were increased (P = 0.001), immature neutrophils were decreased (P = 0.003), mature neutrophils were decreased (P = 0.0004), and lymphocytes were decreased (P = 0.002). Graphs depict arithmetic means ± SD.
Figure 2
Figure 2
PMLRARα and BCL-2 transgenes cooperate to arrest neutrophil differentiation. (A–D) Bone marrow morphology: (A) Control (Cntl); (B) preleukemic PMLRARα (PR); (C) BCL-2; (D) preleukemic PMLRARα/BCL2 (Pre PR/B). Wright's Giemsa stain; original magnifications: ×330. Immature cells are not disseminated in preleukemic doubly transgenic mice. (E–F) Spleen. Red pulp (r); white pulp (w). (G–H) Liver. (I–J) Kidney. (E, G, and I) Control. (F, H, and J) Preleukemic PMLRARα/BCL-2. Hematoxylin and eosin; original magnifications: ×66. Tingible body macrophages are increased in preleukemic PMLRARα/BCL-2 mice. (K and L) Bone marrow histology. (K) Control. (L) Preleukemic PMLRARα/BCL-2. Arrows indicate selected macrophages. Hematoxylin and eosin; original magnifications: ×165.
Figure 3
Figure 3
BCL-2 cooperates with PMLRARα to initiate leukemia. Lethally irradiated nontransgenic FVB/N mice were reconstituted with bone marrow from PMLRARα or PMLRARα/BCL-2 transgenic mice. Kaplan-Meier curves are shown. All PMLRARα/BCL-2 mice died of leukemia. Mortality among PMLRARα mice from causes other than leukemia was censored at the date of death. PMLRARα/BCL-2, n = 13; PMLRARα, n = 27; P < 0.00001.
Figure 5
Figure 5
Leukemic transformation is characterized by dissemination of immature cells. Leukemic PMLRARα/BCL-2. (A) Bone marrow morphology. Wright's Giemsa stain; original magnification: ×330. (B) Spleen. l, leukemic infiltrate. (C) Liver. (D) Kidney. (B–D) Hematoxylin and eosin; original magnifications: ×66.
Figure 4
Figure 4
PMLRARα and PMLRARα/BCL-2 leukemic mice are anemic, thrombocytopenic, and have bone marrow that is filled with promyelocytes. (A) Peripheral blood. Results are displayed as in the legend to Fig. 1 A. Adult controls, n = 7; PMLRARα leukemia, n = 10; PMLRARα/BCL-2 leukemia, n = 10. White blood cell count (WBC) was not significantly different among the groups. Hemoglobin (HGB) and platelet count (PLT) were reduced in leukemic mice (P < 0.00001). (B) Bone marrow. Results are displayed as in the legend to Fig. 1 C. Adult controls, n = 7; PMLRARα leukemia, n = 6; PMLRARα/BCL-2 leukemia, n = 6. All values were significantly different in leukemic mice compared with controls (P < 0.00001 to P = 0.002), but were not significantly different between PMLRARα and PMLRARα/BCL-2 leukemias.
Figure 4
Figure 4
PMLRARα and PMLRARα/BCL-2 leukemic mice are anemic, thrombocytopenic, and have bone marrow that is filled with promyelocytes. (A) Peripheral blood. Results are displayed as in the legend to Fig. 1 A. Adult controls, n = 7; PMLRARα leukemia, n = 10; PMLRARα/BCL-2 leukemia, n = 10. White blood cell count (WBC) was not significantly different among the groups. Hemoglobin (HGB) and platelet count (PLT) were reduced in leukemic mice (P < 0.00001). (B) Bone marrow. Results are displayed as in the legend to Fig. 1 C. Adult controls, n = 7; PMLRARα leukemia, n = 6; PMLRARα/BCL-2 leukemia, n = 6. All values were significantly different in leukemic mice compared with controls (P < 0.00001 to P = 0.002), but were not significantly different between PMLRARα and PMLRARα/BCL-2 leukemias.
Figure 7
Figure 7
APL expressing PMLRARα and BCL-2 is responsive to therapy. (A and B) Unirradiated nontransgenic FVB/N mice received 5 × 10⁶ PMLRARα/BCL-2 leukemic cells by intravenous injection. (A) 14 d after injection of leukemic cells, 5 mg placebo (n = 6) or tRA (n = 6) pellets (21-d release) were implanted into mice. Kaplan-Meier curves are shown. P = 0.02. (B) Bone marrow morphology. Recipients of PMLRARα/BCL-2 leukemic cells were treated with placebo or tRA when ill. PL, placebo-treated; RA, tRA-treated, day 11. Wright's Giemsa stain; original magnification: ×455. (C) FVB/N mice received 107 PMLRARα/BCL-2 leukemic cells. 15 d after injection, mice were treated with tRA and/or arsenic for 4 d. Representative sections of livers are shown. PL, placebo: a leukemic infiltrate is present in the periportal and parenchymal regions of the liver; inset shows immature myeloid cells; tRA, retinoic acid: leukemic cells are much reduced; inset shows hepatocytes accompanied by smaller residual leukemic cells, arrowhead indicates a maturing neutrophil. As, arsenic; leukemic infiltrate present; arrows (inset) indicate condensed nuclei of apoptotic cells. tRA/As, retinoic acid/arsenic: leukemic cells are not seen. Hematoxylin and eosin: original magnifications: ×125; inset ×625.
Figure 7
Figure 7
APL expressing PMLRARα and BCL-2 is responsive to therapy. (A and B) Unirradiated nontransgenic FVB/N mice received 5 × 10⁶ PMLRARα/BCL-2 leukemic cells by intravenous injection. (A) 14 d after injection of leukemic cells, 5 mg placebo (n = 6) or tRA (n = 6) pellets (21-d release) were implanted into mice. Kaplan-Meier curves are shown. P = 0.02. (B) Bone marrow morphology. Recipients of PMLRARα/BCL-2 leukemic cells were treated with placebo or tRA when ill. PL, placebo-treated; RA, tRA-treated, day 11. Wright's Giemsa stain; original magnification: ×455. (C) FVB/N mice received 107 PMLRARα/BCL-2 leukemic cells. 15 d after injection, mice were treated with tRA and/or arsenic for 4 d. Representative sections of livers are shown. PL, placebo: a leukemic infiltrate is present in the periportal and parenchymal regions of the liver; inset shows immature myeloid cells; tRA, retinoic acid: leukemic cells are much reduced; inset shows hepatocytes accompanied by smaller residual leukemic cells, arrowhead indicates a maturing neutrophil. As, arsenic; leukemic infiltrate present; arrows (inset) indicate condensed nuclei of apoptotic cells. tRA/As, retinoic acid/arsenic: leukemic cells are not seen. Hematoxylin and eosin: original magnifications: ×125; inset ×625.
Figure 6
Figure 6
Murine APL is characterized by karyotypic abnormalities. Results of comparative genomic hybridization of 30 APLs (11 female, 19 male) are shown, including 20 PMLRARα and 10 PMLRARα/BCL-2 leukemias. Ideograms of mouse chromosomes are numbered. Each bar to the left of chromosomes indicates a region lost in one leukemic sample. Each bar to the right of chromosomes indicates a region gained in one sample. Each wide bar represents chromosomal gain in 10 samples. Losses of the X chromosome were seen in female samples.

Comment in

References

    1. Cline M.J. The molecular basis of leukemia. N. Engl. J. Med. 1994;330:328–336. - PubMed
    1. Look A.T. Oncogenic transcription factors in the human acute leukemias. Science. 1997;278:1059–1064. - PubMed
    1. Melnick A., Licht J.D. Deconstructing a diseaseRARα, its fusion partners, and their roles in the pathogenesis of acute promyelocytic leukemia. Blood. 1999;93:3167–3215. - PubMed
    1. Brown D., Kogan S., Lagasse E., Weissman I., Alcalay M., Pelicci P.G., Atwater S., Bishop J.M. A PMLRARα transgene initiates murine acute promyelocytic leukemia. Proc. Natl. Acad. Sci. USA. 1997;94:2551–2556. - PMC - PubMed
    1. Grisolano J.L., Wesselschmidt R.L., Pelicci P.G., Ley T.J. Altered myeloid development and acute leukemia in transgenic mice expressing PML-RARα under control of cathepsin G regulatory sequences. Blood. 1997;89:376–387. - PubMed

Publication types

MeSH terms

Substances