. 2001;2(2):RESEARCH0004.
doi: 10.1186/gb-2001-2-2-research0004. Epub 2001 Jan 22.

Protein microarrays for highly parallel detection and quantitation of specific proteins and antibodies in complex solutions

Affiliations

Protein microarrays for highly parallel detection and quantitation of specific proteins and antibodies in complex solutions

B B Haab et al. Genome Biol. 2001.

Abstract

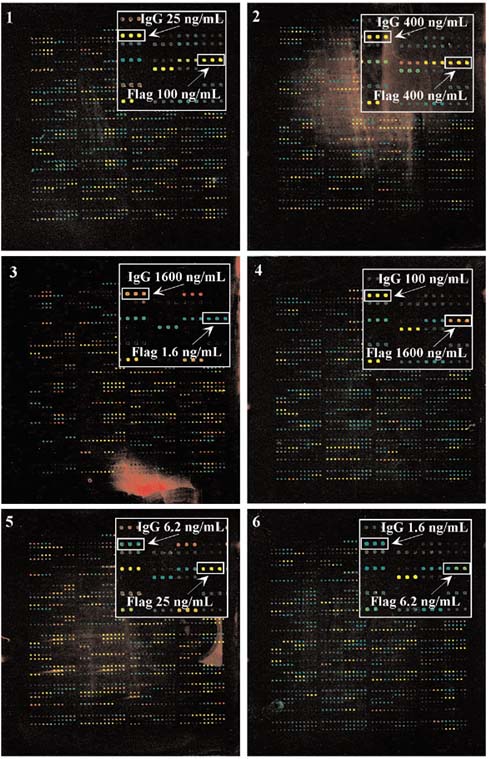
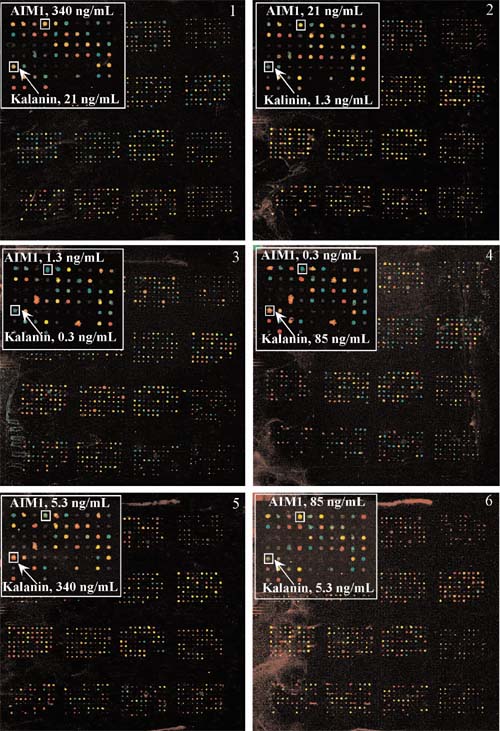
Background: We have developed and tested a method for printing protein microarrays and using these microarrays in a comparative fluorescence assay to measure the abundance of many specific proteins in complex solutions. A robotic device was used to print hundreds of specific antibody or antigen solutions in an array on the surface of derivatized microscope slides. Two complex protein samples, one serving as a standard for comparative quantitation, the other representing an experimental sample in which the protein quantities were to be measured, were labeled by covalent attachment of spectrally resolvable fluorescent dyes.

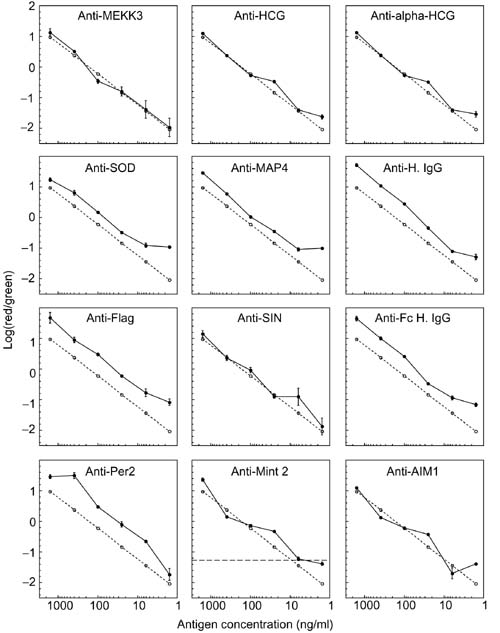
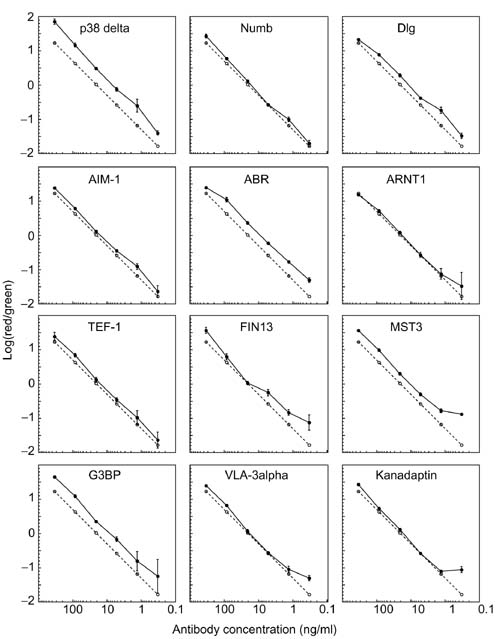
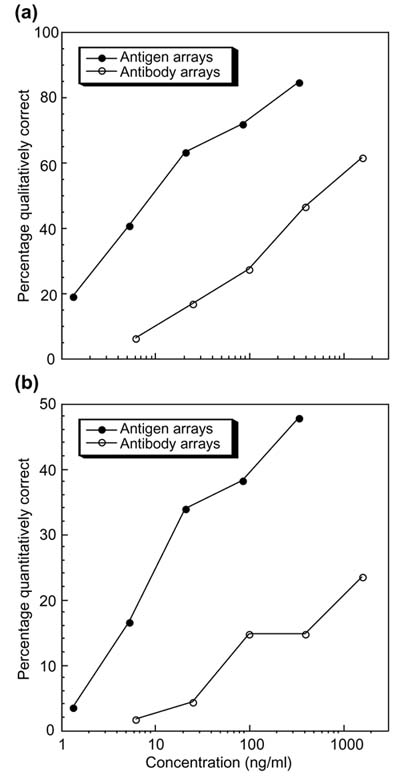
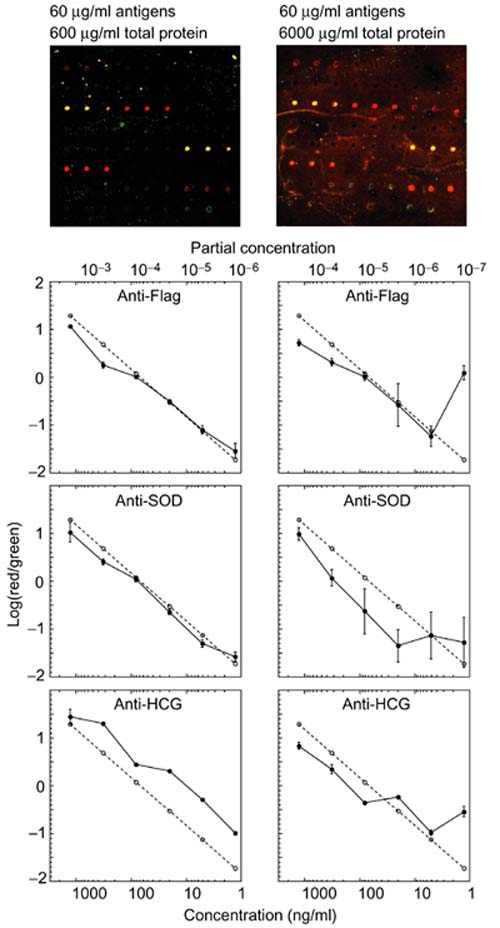
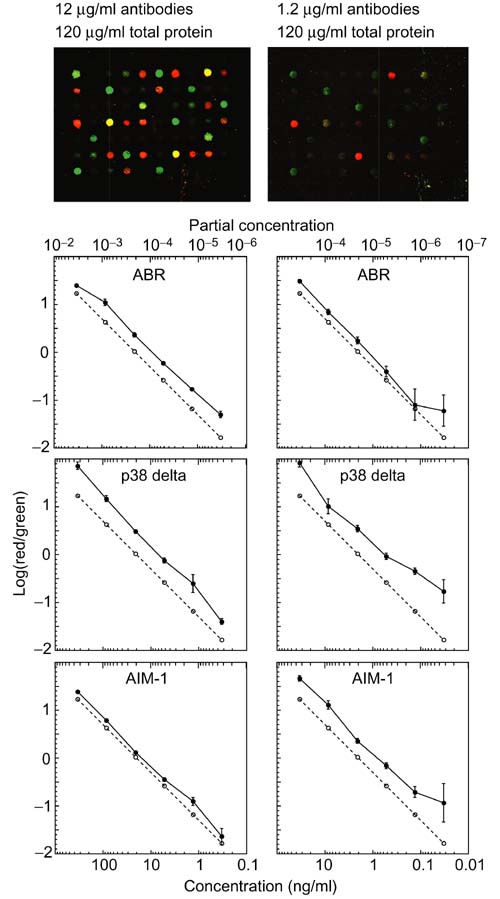
Results: Specific antibody-antigen interactions localized specific components of the complex mixtures to defined cognate spots in the array, where the relative intensity of the fluorescent signal representing the experimental sample and the reference standard provided a measure of each protein's abundance in the experimental sample. To test the specificity, sensitivity and accuracy of this assay, we analyzed the performance of 115 antibody/antigen pairs. 50% of the arrayed antigens and 20% of the arrayed antibodies provided specific and accurate measurements of their cognate ligands at or below concentrations of 0.34 microg/ml and 1.6 microg/ml, respectively. Some of the antibody/antigen pairs allowed detection of the cognate ligands at absolute concentrations below 1 ng/ml, and partial concentrations of 1 part in 106, sensitivities sufficient for measurement of many clinically important proteins in patient blood samples.

Conclusions: These results suggest that protein microarrays can provide a practical means to characterize patterns of variation in hundreds of thousands of different proteins in clinical or research applications.


Figures

Figure 1
Figure 1
Antibody array detection of labeled antigens. 114 different antibodies were spotted onto poly-L-lysine coated slides 6-12 times each at a 375 μm spacing. Six protein mixes were labeled and detected according to the Materials and methods section. The inset in each panel highlights anti-Flag and anti-IgG spots, and the labels indicate the concentration of the antigen applied to each array. The images were normalized (see the Materials and methods section) and contrast adjusted to better show bright features.
Figure 2
Figure 2
Antigen array detection of labeled antibodies. 116 different antigens were spotted with 6-12 replicates at a 375 μm spacing. Labeling, detection, and image processing were as described in Materials and methods section. The inset in each panel highlights AIM1 and Kalanin B1 spots detecting the indicated concentrations of corresponding antibody.
Figure 3
Figure 3
Relationship between the Cy5/Cy3 fluorescence ratios measured with antibody microarrays and the concentration ratios of the cognate antigens. The log10 of the Cy5/Cy3 fluorescence ratio was calculated for each antibody spot shown in Figure 1. The median values of the replicate measurements from 12 antibodies were plotted as a function of the concentrations of the corresponding antigens. The error bars represent the standard deviation between the replicate spots. The dashed line represents the known concentration ratio of the cognate antigen. The horizontal dashed line in the Anti-Mint2 panel represents a threshold to assess the reliability of detecting large oncentration changes (see text). It is determined by adding two standard deviations to the value measured at the final dilution.
Figure 4
Figure 4
Relationship between the Cy5/Cy3 fluorescence ratios measured using antigen microarrays and the concentration ratio of the cognate antibodies. The median of the log10 transformed Cy5/Cy3 fluorescence ratios of the indicated antigens from Figure 2 were plotted as a function of concentration ratio, as in Figure 3. Median values from the replicate spots are presented along with the concentration ratio of the cognate antibody, represented by the dashed line. The error bars represent the standard deviation between the replicate spots.
Figure 5
Figure 5
(a) Percentage of antibodies and antigens yielding qualitatively correct results as a function of analyte concentration. An antibody or antigen was determined to yield qualitatively correct results if 100% of the replicate spots at or above a given concentration segregated above a low concentration threshold. The low concentration threshold was calculated by averaging the Cy5/Cy3 fluorescence ratio measured at the lowest tested concentration of the target antibody or antigen and adding two times the standard deviation of the ratio measured at the cognate spots. (T = X + 2S, where T = the threshold, X = the average, and S = the standard deviation.) (b) Percentage of antibodies or antigens yielding quantitatively correct results versus concentration. An antibody or antigen measurement was considered quantitatively accurate if it both fulfilled the criteria for qualitative accuracy in (a) and in addition, the measured R/G ratio fell within a factor of two of the known concentration ratio.
Figure 6
Figure 6
The effect of protein concentration on background and detection limits. Six antigen mixes were added to fetal calf serum (FCS) solutions to produce a 10-fold and 100-fold increase in total protein concentration and a corresponding decrease in partial concentration of the antigens. After labeling, the mixes were analyzed with antibody microarrays. The images at the top of the figure present a detail from one of the arrays in each set. The median log10 of the Cy5/Cy3 fluorescence ratio is plotted as a function of the concentration ratio of the cognate antigen of the three indicated antibodies. The dashed line represents the log10 of the true ratio of antigen concentrations in the Cy5-labeled and Cy3-labeled solutions.
Figure 7
Figure 7
Investigation of partial concentration and absolute concentration detection limits. Six antibody mixes were added to FCS solutions to produce a 10-fold and 100-fold increase in total protein concentration and a corresponding decrease in partial concentration. The high protein solution was diluted 10-fold, so that the total protein concentration was equivalent between the mixes. The images at the top of the figure present a detail from one of the arrays in each set. The median log10 Cy5/Cy3 fluorescence ratio is plotted as a function of cognate antibody for the three indicated antigens. The dashed line represents the log10 of the true ratio of antigen concentrations in the Cy5-labeled and Cy3-labeled solutions.

References

    1. Abbott A. A post-genomic challenge: learning to read patterns of protein synthesis. Nature. 1999;402:715–720. - PubMed
    1. Humphery-Smith I, Blackstock W. Proteome analysis: genomics via the output rather than the input code. J Protein Chem. 1997;16:537–544. - PubMed
    1. Emmert-Buck MR, Gillespie JW, Paweletz CP, Ornstein DK, Basrur V, Appella E, Quan-Hong W, Huang J, Hu N, Taylor P, et al. An approach to proteomic analysis of human tumors. Mol Carcinog. 2000;27:158–165. - PubMed
    1. Pandey A, Mann M. Proteomics to study genes and genomes. Nature. 2000;405:837–846. - PubMed
    1. Rabilloud T. Detecting proteins separated by 2-D gel electrophoresis. Anal Chem. 2000;72:48A–55A. - PubMed

Publication types