Review
. 2000 Sep-Oct;2(5):388-417.
doi: 10.1038/sj.neo.7900118.

Developments toward diagnostic breast cancer imaging using near-infrared optical measurements and fluorescent contrast agents

Affiliations
Review

Developments toward diagnostic breast cancer imaging using near-infrared optical measurements and fluorescent contrast agents

D J Hawrysz et al. Neoplasia. 2000 Sep-Oct.

Abstract

The use of near-infrared (NIR) light to interrogate deep tissues has enormous potential for molecular-based imaging when coupled with NIR excitable dyes. More than a decade has now passed since the initial proposals for NIR optical tomography for breast cancer screening using time-dependent measurements of light propagation in the breast. Much accomplishment in the development of optical mammography has been demonstrated, most recently in the application of time-domain, frequency-domain, and continuous-wave measurements that depend on endogenous contrast owing to angiogenesis and increased hemoglobin absorbance for contrast. Although exciting and promising, the necessity of angiogenesis-mediated absorption contrast for diagnostic optical mammography minimizes the potential for using NIR techniques to assess sentinel lymph node staging, metastatic spread, and multifocality of breast disease, among other applications. In this review, we summarize the progress made in the development of optical mammography, and focus on the emerging work underway in the use of diagnostic contrast agents for the molecular-based, diagnostic imaging of breast.


Figures

Figure 1
Figure 1
Schematic of continuous-wave measurement approach used in NIR optical imaging, (a) Continuous-wave (CW) imaging approaches utilize an incident, constant-intensity illumination that creates a steady light distribution in the tissue that exponentially attenuates with distance from a source point. (b) Measurement schemes can utilize the wavelength dependence of the attenuated light detected some distance away from the light.
Figure 2
Figure 2
Schematic of time-domain measurement approaches used in NIR optical tomography. TDPM-imaging approaches utilize an incident impulse of light that results in the propagation of the pulse throughout the tissue that attenuates as a function of distance from the source and time following its incident impulse. The detected pulse is measured as intensity versus time and represents the photon times-of-flight. Panel (a) illustrates the light distribution in tissue from a pulse point source after 1x10⁻¹⁰ second, (b) 25x10-10 second and (c) 150x10-10 second following the incident impulse. The corresponding recorded data during the time intervals at the detector is illustrated in panels (d) through (f). A time-gated illumination measurement is shown in panel (f) in which the integrated intensity measured within a specified window is measured.
Figure 3
Figure 3
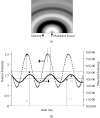
Schematic of the frequency-domain measurement approach used in NIR optical tomography. FDPM imaging consists of an incident, intensity-modulated light source that creates a “photon density wave” that propagates continuously throughout the tissue. Panel (a) is a depiction of light distribution in tissue due to a modulated source (exaggerated for purposes of illustration) and panel (b) illustrates the detected signal (in red) in response to the source illumination (in blue). The typical frequency-domain data, where the measurable quantities are the phase shift, the amplitude of each wave IAC, and the bias of each wave Φ DC. As shown in panel (b), the intensity wave that is detected some distance away from the source is amplitude attenuated and phase-delayed relative to the source.
Figure 4
Figure 4
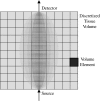
The differences between NIR optical tomography and other conventional imaging modalities is illustrated herein. In conventional imaging modality, the signal used to reconstruct an image originates from one volume element, or voxel, from the tissue while in NIR optical tomography techniques, the measured signal has weighted contributions from a number of different volume elements through which propagating light can travel from the source to the detector on the tissue surfaces.
Figure 5
Figure 5
General illustration of (a) the forward imaging problem in which the tissue optical properties are known and used to predict the measurement and (b) the inverse imaging problem in which the measurements are used to obtain the unknown tissue optical properties.
Figure 6
Figure 6
Schematic of the formal inversion approach that updates the interior optical-property map using the Jacobian, or the slope of the surface of the error map shown herein, to find the minimum error or “well” that identifies the correct reconstructed image. See text for description.
Figure 7
Figure 7
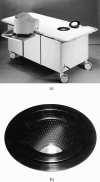
Illustration of (a) the Philips Optical Mammo Prototype system and (b) the detail of the cup area of the unit. The fan of light shows the distribution of the light from a single fiber optic. During data acquisition, which takes about 2 minutes per wavelength, the pendulant breast of the patient is placed in the cup filled with an optically matched fluid. Transmission measurements are then performed by individually shining light into the cup from each of the 255 source fibers. The resultant 255x255 set of transmission measurements are then used for image construction. Reproduced with permission from: http://www.research.philips.com/generalinfo/special/medopt/mammoscope.html.
Figure 8
Figure 8
Examples of the Philips mammography images for a breast mass of 1 to 2 cm in diameter from conventional X-ray mamograms in the (a) craniocaudal and (b) mediolateral views. The images reconstructed from CW measurements at 780 nm are also shown for the (c) craniocaudal, mediolateral and coronal view images of the same patient. The mass is identified by regions of high attenuation (red). Reproduced with permission from: http://www.research.philips.com/generalinfo/special/medopt/mammoscope.html.
Figure 9
Figure 9
Examples of the Philips mammography images for a fluid-filled cyst reconstructed from CW measurements at 780 nm are also shown for the craniocaudal, mediolateral and coronal view images of another patient. In contrast to the optical mammograms illustrated in Figure 8, the fluid-filled cyst is demarcated by regions of low attenuation (blue). Reproduced with permission from: http://www.research.philips.com/generalinfo/special/medopt/mammoscope.html.
Figure 10
Figure 10
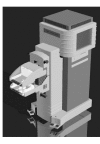
An example of the compressed issue optical scanner from Aerospace Research Technologies, Inc. (ART) that employs scanning of source and detecting fibers for data acquisition. Reproduced with permission from: http://www.softscan.com/default.html.
Figure 11
Figure 11
X-ray mammograms in (a) craniocaudal and (b) mediolateral views of a 72-year-old woman with invasive ductal carcinoma with a 0.5-cm-diameter primary tumor. The FDPM derived optical mammograms of parameter “N” in (c) cranial caudal and (d) mediolateral views from scanning 810-nm FDPM measurements. Reproduced with permission from Franceschini et al. [68].
Figure 12
Figure 12
The (a) schematic and (b) photograph of the Dartmouth mammographic imaging system that utilizes a CW Ti:sapphire laser with an electro-optic modulator to produce intensity-modulated incident light at 100 MHz and variable wavelength. The source light is coupled sequentially into 16 individual fibers positioned on the circumferential surface of a pendulant breast and the light that propagates through the tissues is detected by another 16 fiber optics, which is coupled sequentially into a detector. The set-up allows for variable diameter of the circumferential gantry of fiber optics and its vertical translation. Illustration reproduced with permission from McBride et al. [70] and photograph provided by B. Pogue.
Figure 13
Figure 13
Two-dimensional reconstruction from data gathered in the apparatus described in Figure 12 for (a) a patient with a 0.8-cm-diameter invasive carcinoma in tissues surrounded by the 6.4-cm-diameter gantry of sources and detectors, and (b) the normal contralateral breast. The scale bar is calibrated hemoglobin concentration in micromolar units The position of increased hemoglobin concentration coincides with the locations identified by the radiologist. Provided by B. Pogue.
Figure 14
Figure 14
The Jablonski diagram illustrating the activation of fluorophore to its single excited state and its nonradiative and radiative (fluorescence) relaxation to the ground state. The fluorescence lifetime, τ, is equivalent to the mean time that the fluorophore remains in its activated state and the quantum efficiency is the proportion of relaxations that occur radiatively. In PDT agents, the singlet excited state can undergo “intersystem crossing” in which the spin state of the electron is flipped. Relaxation of the triplet excited state is forbidden until the electron spin state is reversed. The lifetimes of the triplet state are on the order of microseconds to milliseconds and are termed phosphorescence.
Figure 15
Figure 15
Schematic detailing the propagation of excitation photon density waves (solid lines) and their perturbation by absorbing heterogeneities (dotted lines) and the generation of emission photon density waves (solid, grey lines) within tissues. Fluorescence contrast-enhance optical tomography provides greater localization capability because the detected emission waves act as “beacons” providing information regarding the tagged heterogeneity.
Figure 16
Figure 16
Solution of the FORWARD and INVERSE imaging problems for a 4x4x4-cm simulated tissue phantom with eight NIR sources in planar geometry and 90 detectors distributed on the same plane as the sources and distributed on the opposite plane in transillumination geometry. Panel (a) shows the actual distribution of absorption owing to fluorophore with a 10:1 uptake in five heterogeneities of approximately 5-mm diameter. Panel (b) illustrates the image reconstruction accomplished through APPRIZE Bayesian technologies using phase measurements with ample noise. Panel (b) required little more than 4 minutes on a 350 MHz Pentium II PC to compute. Provided by M. Eppstein.
Figure 17
Figure 17
Demonstration of three-dimensional reconstruction of 10-fold uptake in three heterogeneities each occupying 0.04% of the total volume of a frustum. Panels (a) through (c) illustrate the true image represented as “slices” through the three-dimensional geometry whereas panels (d) through (f) illustrate the recovered images using synthetic emission FDPM measurements with 35-dB SNR. Using 43 sources and 42 detectors located at the surface of the frustum at varying heights, the images reconstructed in three dimensions match well the actual situation without the “blurring” or diffuse imaging prevalent in NIR tomography based on endogenous absorption. Provided by R. Roy.
Figure 18
Figure 18
Photograph illustrating the use of an incident expanded beam on the mammary chain of the canine to excite systemically administered fluorophore and to collect the emission of generated light from the tissue surface.
Figure 19
Figure 19
The 128x128-pixel-based imaging of 830-nm fluorescence of (a) CWDC, (b) amplitude IAC, (c) phase delay and (d) modulation ratio of the detected fluorescence generated from the area cranial of the left fourth mammary gland of a canine. Illumination was accomplished with an expanded 780-nm laser diode. Modulation frequency was 100 MHz. Reproduced with permission from Reynolds et al. [104].
Figure 20
Figure 20
The 128x128-pixel-based imaging of 830-nm fluorescence of (a) CW DC, (b) amplitude IAC, (c) phase delay and (d) modulation ratio of the detected fluorescence generated from the area cranial of the left fifth mammary gland of a canine. Illumination was accomplished with an expanded 780-nm laser diode. Modulation frequency was 100 MHz. Reproduced with permission from Reynolds et al. [104].
Figure 21
Figure 21
The 128x128-pixel-based imaging of 830-nm fluorescence of (a) CW DC, (b) amplitude IAC, (c) phase delay and (d) modulation ratio of the detected fluorescence generated from a lymph node in the area of the right fifth mammary gland. Illumination was accomplished with an expanded 780-nm laser diode. Modulation frequency was 100 MHz. Reproduced with permission from Reynolds et al. [104].

Similar articles

Cited by

References

    1. Tromberg BJ, Shah N, Lanning R, Cerussi A, Espinoza J, Phain T, Svaasand L, Butler J. Non-invasive in vivo characterization of breast tumors using photon migration spectroscopy. Neoplasia. 2000;2:26–40. - PMC - PubMed
    1. Doornbos RMP, Lang R, Aalders MC, Cross FW, Sterenborg HJCM. The determination of in vivo human tissue optical properties and absolute chromophore concentrations using spatially resolved steady-state diffuse reflectance spectroscopy. Phys Med Biol. 1999;44:967–981. - PubMed
    1. Chance B, Leigh JS, Miyake H, Smith DS, Nioka S, Greenfeld R, Finander M, Kaufmann K, Levy W, Young M, Cohen P, Yoshioka H, Boretsky R. Comparison of time-resolved and-unresolved measurements of deoxyhemoglobin in brain. Proc Natl Acad Sci USA. 1988;85:4791–4975. - PMC - PubMed
    1. Balgi G, Reynolds JS, Mayer RH, Cooley R, Sevick-Muraca EM. Measurements of multiply scattered light for on-line monitoring of changes in size distribution of cell-debris suspensions. Biotechnol Prog. 1999;15:1106–1114. - PubMed
    1. Grosenick D, Wabnitz H, Rinnebert HH, Moesta KT, Schlag PM. Development of a time-domain optical mammography and first in vivo applications. Appl Opt. 1999;38:2927–2943. - PubMed

Publication types

MeSH terms