. 2001 Jan 15;193(2):219-31.
doi: 10.1084/jem.193.2.219.

Fatal leukemia in interleukin 15 transgenic mice follows early expansions in natural killer and memory phenotype CD8+ T cells

Affiliations

Fatal leukemia in interleukin 15 transgenic mice follows early expansions in natural killer and memory phenotype CD8+ T cells

T A Fehniger et al. J Exp Med. .

Abstract

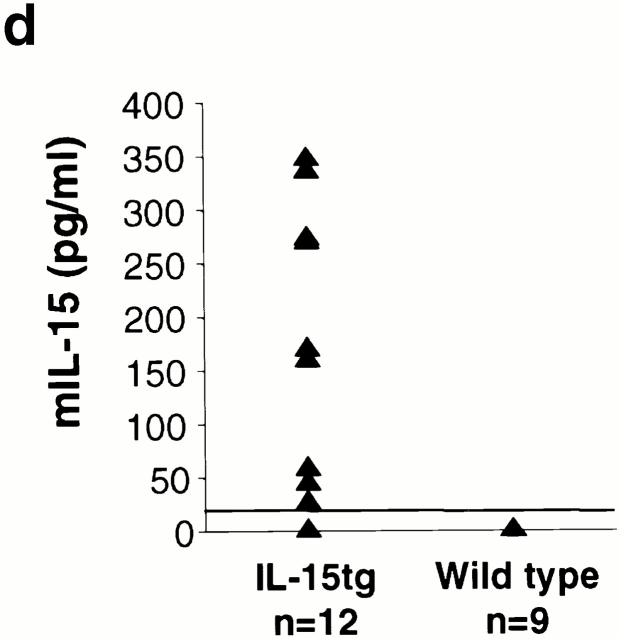
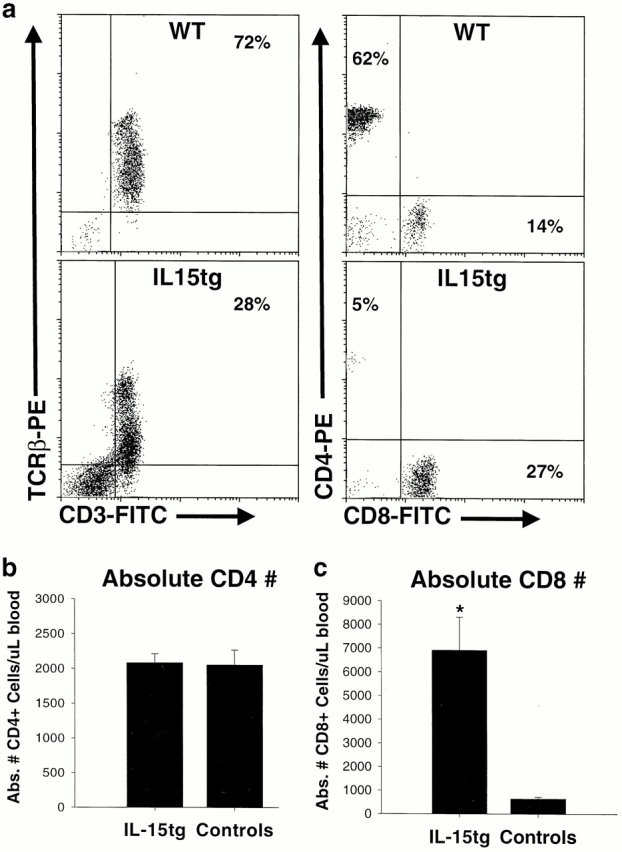
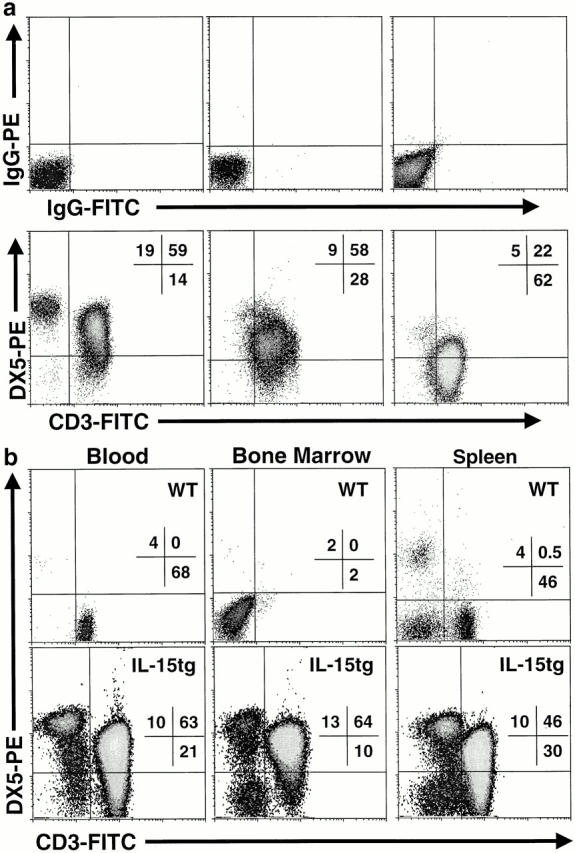
Inflammation likely has a role in the early genesis of certain malignancies. Interleukin (IL)-15, a proinflammatory cytokine and growth factor, is required for lymphocyte homeostasis. Intriguingly, the expression of IL-15 protein is tightly controlled by multiple posttranscriptional mechanisms. Here, we engineered a transgenic mouse to overexpress IL-15 by eliminating these posttranscriptional checkpoints. IL-15 transgenic mice have early expansions in natural killer (NK) and CD8+ T lymphocytes. Later, these mice develop fatal lymphocytic leukemia with a T-NK phenotype. These data provide novel evidence that leukemia, like certain other cancers, can arise as the result of chronic stimulation by a proinflammatory cytokine.


Figures

Figure 1
Figure 1
Structure of the IL-15 transgene. Three primary posttranscriptional checkpoints were eliminated: 5′ AUGs, the inefficient IL-15 signal peptide, and a COOH terminus retention sequence. Near global overexpression was achieved by the MHC class I promoter, efficient translation and secretion by use of the IL-2 signal peptide, and stabilization of COOH terminus by the addition of the FLAG epitope. The 3′ portion of the hGH gene is fused out of frame for straightforward identification of the transgene by Southern blot and to optimize transgene expression in vivo.
Figure 2
Figure 2
Detection and expression of the IL-15 transgene. (a) Three FVB/N IL-15tg lines positive by Southern blot analysis with hGH gene probe (3284, 3285, 3304), while negative line (3286) is shown for comparison. Triangle denotes the expected 2.6-kb size of the SstI digested transgene. (b) Real time RT-PCR of tissues from a representative IL-15tg mouse. Results show the mean ± SEM of triplicate measurements of IL-15 transgene expression from total cellular RNA, isolated from IL-15tg tissues. Sm. Int., small intestine; Lg. Int., large intestine; Sk. Musc., skeletal muscle; BM, bone marrow. (c) Immunoblot analysis of splenocyte lysates for transgenic protein with the FLAG epitope tag. Equal amounts of total cellular protein were loaded as follows: lane 1, spleen cells from nontransgenic wild-type FVB mouse; and lanes 2–4, spleen cells from three different IL-15tg mice. (d) IL-15 protein levels in IL-15tg mice. Serum from IL-15tg mice and nontransgenic wild-type controls were analyzed using a specific murine IL-15 ELISA (see Materials and Methods).
Figure 2
Figure 2
Detection and expression of the IL-15 transgene. (a) Three FVB/N IL-15tg lines positive by Southern blot analysis with hGH gene probe (3284, 3285, 3304), while negative line (3286) is shown for comparison. Triangle denotes the expected 2.6-kb size of the SstI digested transgene. (b) Real time RT-PCR of tissues from a representative IL-15tg mouse. Results show the mean ± SEM of triplicate measurements of IL-15 transgene expression from total cellular RNA, isolated from IL-15tg tissues. Sm. Int., small intestine; Lg. Int., large intestine; Sk. Musc., skeletal muscle; BM, bone marrow. (c) Immunoblot analysis of splenocyte lysates for transgenic protein with the FLAG epitope tag. Equal amounts of total cellular protein were loaded as follows: lane 1, spleen cells from nontransgenic wild-type FVB mouse; and lanes 2–4, spleen cells from three different IL-15tg mice. (d) IL-15 protein levels in IL-15tg mice. Serum from IL-15tg mice and nontransgenic wild-type controls were analyzed using a specific murine IL-15 ELISA (see Materials and Methods).
Figure 3
Figure 3
Early lymphocytosis in IL-15tg mice. (a and b) Total white blood cell (WBC) and lymphocyte counts in IL-15tg (n = 71) and nontransgenic littermate control (n = 51) at 6 wk of age. Graphs show the mean ± SEM, with a significant increase in both the absolute white blood cell (*, P < 10−7) and lymphocyte counts (**, P < 10−8) in IL-15tg mice. (c and d) Representative photomicrographs at low (40×) and high (100×) magnification of peripheral blood smears from a 6-wk-old IL-15tg mouse (IL-15tg) and a nontransgenic littermate control (WT Control). Note expansion of large granular lymphocytes in IL-15tg mouse smear.
Figure 3
Figure 3
Early lymphocytosis in IL-15tg mice. (a and b) Total white blood cell (WBC) and lymphocyte counts in IL-15tg (n = 71) and nontransgenic littermate control (n = 51) at 6 wk of age. Graphs show the mean ± SEM, with a significant increase in both the absolute white blood cell (*, P < 10−7) and lymphocyte counts (**, P < 10−8) in IL-15tg mice. (c and d) Representative photomicrographs at low (40×) and high (100×) magnification of peripheral blood smears from a 6-wk-old IL-15tg mouse (IL-15tg) and a nontransgenic littermate control (WT Control). Note expansion of large granular lymphocytes in IL-15tg mouse smear.
Figure 4
Figure 4
Early expansions in NK cell number and function within IL-15tg mice. (a) Flow cytometric analysis of peripheral blood lymphocytes from representative IL-15tg and nontransgenic littermate wild-type controls (WT). NK cells are DX5+CD3Ly49+/−, whereas T cells are CD3+DX5Ly49D. (b) IL-15tg mice (n = 71) have a significant increase in the absolute NK cell number, compared with nontransgenic littermate controls (n = 51; *, P < 10−11). Data shown are the mean ± SEM. (c) Cytotoxicity of fresh leukocytes isolated from IL-15tg or nontransgenic wild-type littermate controls (WT) against YAC-1 tumor targets, without any additional in vitro or in vivo activation. Data shown are the mean ± SEM of triplicate wells from three representative IL-15tg and two wild-type control mice.
Figure 6
Figure 6
Memory phenotype of expanded CD8+ T cells. Flow cytometric analysis of peripheral blood lymphocytes from a representative IL-15tg mouse at 6 wk of age, demonstrating the CD44hiLy6C+CD69CD62Llo phenotype, with a nontransgenic littermate control shown for comparison. Similar results were obtained in all IL-15tg mice examined (n = 10). WT, wild-type.
Figure 5
Figure 5
Early expansion of CD8+ T cells within IL-15tg mice. (a) Flow cytometric analysis of peripheral blood lymphocytes from representative IL-15tg and nontransgenic littermate wild-type controls (WT). Most lymphocytes in wild-type mice are CD3+TCR-β+ T cells, and the percentage of this population is reduced in IL-15tg mice due to dilution by the expanded NK cells. The CD4/CD8 ratio is significantly inverted in IL-15tg mice. (b) The absolute number of CD4+ T cells is identical in IL-15tg and control mice. (c) The absolute number of CD8+ T cells is significantly increased in IL-15tg (P < 10−4), compared with control mice. This increase in CD8+ T cells is responsible for the CD4/CD8 ratio. For b and c, data represent the mean CD4 or CD8 counts ± SEM of IL-15tg (n ± 71) and control (n = 51) mice.
Figure 7
Figure 7
IL-15tg mice develop fatal lymphocytic leukemia with age. (a) Flow cytometric analyses of peripheral blood lymphocytes isolated from representative IL-15tg mice immediately before death. Although the DX5+CD3 NK cell expansion persisted, the major lymphocyte population is CD3+TCR-β+DX5hi/lo/neg T cells. Results shown are from three different IL-15tg mice with isotype control staining shown above the DX5 and CD3 stained cells for each IL-15tg leukemia. (b) Similar lymphocyte expansions are evident in multiple lymphoid tissues from leukemic IL-15tg mice (blood, spleen, bone marrow), as illustrated by a representative IL-15tg mouse. Tissues from a nontransgenic littermate control are shown for comparison. WT, wild-type. (c) Leukemic IL-15tg mice have gross splenomegaly, as evidenced by increased spleen to body weight ratio. Graph shows the mean spleen/body weight ratio ± SEM of 22 leukemic IL-15tg mice. (d) Photomicrographs (100×) illustrating the morphology of the leukemic lymphocytes from peripheral blood smears of four representative IL-15tg mice.
Figure 7
Figure 7
IL-15tg mice develop fatal lymphocytic leukemia with age. (a) Flow cytometric analyses of peripheral blood lymphocytes isolated from representative IL-15tg mice immediately before death. Although the DX5+CD3 NK cell expansion persisted, the major lymphocyte population is CD3+TCR-β+DX5hi/lo/neg T cells. Results shown are from three different IL-15tg mice with isotype control staining shown above the DX5 and CD3 stained cells for each IL-15tg leukemia. (b) Similar lymphocyte expansions are evident in multiple lymphoid tissues from leukemic IL-15tg mice (blood, spleen, bone marrow), as illustrated by a representative IL-15tg mouse. Tissues from a nontransgenic littermate control are shown for comparison. WT, wild-type. (c) Leukemic IL-15tg mice have gross splenomegaly, as evidenced by increased spleen to body weight ratio. Graph shows the mean spleen/body weight ratio ± SEM of 22 leukemic IL-15tg mice. (d) Photomicrographs (100×) illustrating the morphology of the leukemic lymphocytes from peripheral blood smears of four representative IL-15tg mice.
Figure 8
Figure 8
Clonal TCR-β T cell expansion in IL-15tg mice. (a) Schematic of an example rearranged TCR-β gene that was observed in an IL-15tg mouse that died of fatal lymphocytic leukemia. (b) DNA PCR gel showing a monoclonal Jβ2.7 usage in the expanded lymphocytes from an IL-15tg mouse (tg), compared with polyclonal control (C). (c) DNA PCR gel showing a monoclonal Vβ16-Dβ2-Jβ2.7 usage in the expanded lymphocytes from an IL-15tg mouse. A faint band is visible with the prominently used Vβ4, and is present on most gels examining the FVB/N TCR-β. (d) Example of a clonal TCR Vβ6+ T cell population in a different IL-15tg mouse with fatal leukemia by flow cytometry. Blood cells were gated on CD3+ lymphocytes and assessed for expression of the Vβ6 TCR.
Figure 8
Figure 8
Clonal TCR-β T cell expansion in IL-15tg mice. (a) Schematic of an example rearranged TCR-β gene that was observed in an IL-15tg mouse that died of fatal lymphocytic leukemia. (b) DNA PCR gel showing a monoclonal Jβ2.7 usage in the expanded lymphocytes from an IL-15tg mouse (tg), compared with polyclonal control (C). (c) DNA PCR gel showing a monoclonal Vβ16-Dβ2-Jβ2.7 usage in the expanded lymphocytes from an IL-15tg mouse. A faint band is visible with the prominently used Vβ4, and is present on most gels examining the FVB/N TCR-β. (d) Example of a clonal TCR Vβ6+ T cell population in a different IL-15tg mouse with fatal leukemia by flow cytometry. Blood cells were gated on CD3+ lymphocytes and assessed for expression of the Vβ6 TCR.
Figure 9
Figure 9
Progressive alopecia in IL-15tg mice. Photograph of a representative 18-wk-old IL-15tg mouse, illustrating the progressive alopecia that involves 50–90% of the skin surface area. The alopecia typically begins at 4–6 wk of age initially involving the head and proximal limbs. A sex- and age-matched wild-type FVB mouse is shown below for comparison.
Figure 10
Figure 10
Multiorgan lymphocytic infiltration in IL-15tg mice. Histology sections of skin (a–c), lung (d–f), and liver (g–i) stained with hematoxylin and eosin. Low power (10×) micrographs contrast wild-type (a, d, and g) and IL-15tg (b, e, and h) tissues. High power (40×) micrographs demonstrate the lymphocytic morphology of the infiltrating cells in the IL-15tg mice (c, f, and i). See Results for detailed description of the pathology.

References

    1. Fehniger T.A., Caligiuri M.A. Interleukin 15biology and relevance to human disease. Blood. 2001;97:14–32. - PubMed
    1. Grabstein K.H., Eisenman J., Shanebeck K., Rauch C., Srinivasan S., Fung V., Beers C., Richardson J., Schoenborn M.A., Ahdieh M. Cloning of a T cell growth factor that interacts with the beta chain of the interleukin-2 receptor. Science. 1994;264:965–968. - PubMed
    1. Giri J.G., Ahdieh M., Eisenman J., Shanebeck K., Grabstein K., Kumaki S., Namen A., Park L.S., Cosman D., Anderson D. Utilization of the beta and gamma chains of the IL-2 receptor by the novel cytokine IL-15. EMBO (Eur. Mol. Biol. Organ.) J. 1994;13:2822–2830. - PMC - PubMed
    1. Giri J.G., Kumaki S., Ahdieh M., Friend D.J., Loomis A., Shanebeck K., DuBose R., Cosman D., Park L.S., Anderson D.M. Identification and cloning of a novel IL-15 binding protein that is structurally related to the alpha chain of the IL-2 receptor. EMBO (Eur. Mol. Biol. Organ.) J. 1995;14:3654–3663. - PMC - PubMed
    1. Bamford R.N., Grant A.J., Burton J.D., Peters C., Kurys G., Goldman C.K., Brennan J., Roessler E., Waldmann T.A. The interleukin (IL) 2 receptor beta chain is shared by IL-2 and a cytokine, provisionally designated IL-T, that stimulates T-cell proliferation and the induction of lymphokine-activated killer cells. Proc. Natl. Acad. Sci. USA. 1994;91:4940–4944. - PMC - PubMed

Publication types