. 2001 Jan 15;530(Pt 2):307-17.
doi: 10.1111/j.1469-7793.2001.0307l.x.

Interactions between two different inhibitory systems in the human motor cortex

Affiliations

Interactions between two different inhibitory systems in the human motor cortex

T D Sanger et al. J Physiol. .

Abstract

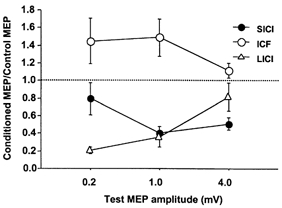
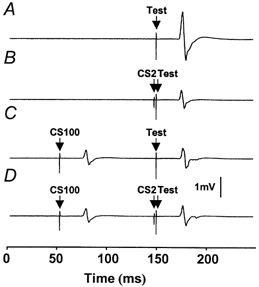
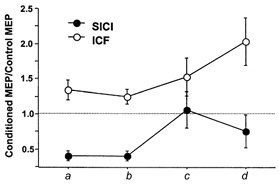
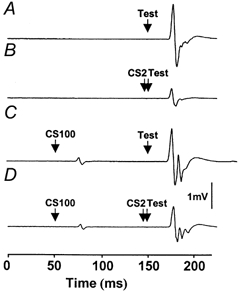
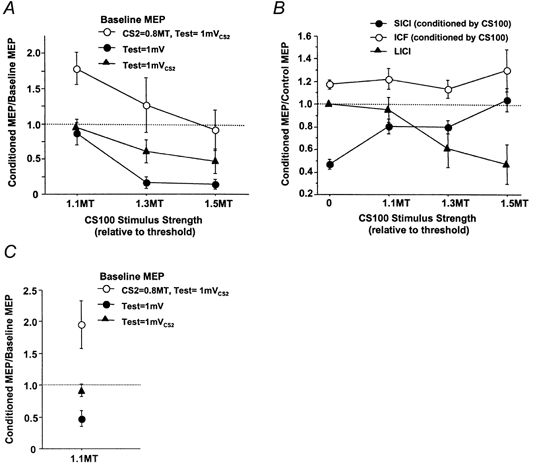
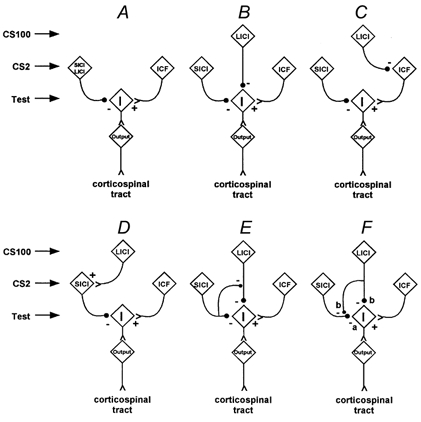
Intracortical inhibition in the human motor cortex has been previously demonstrated using paired-pulse transcranial magnetic stimulation (TMS) protocols at short intervals (1-6 ms; short interval intracortical inhibition, SICI) with a subthreshold conditioning pulse preceding a suprathreshold test pulse, and at long intervals (50-200 ms; long interval intracortical inhibition, LICI) with suprathreshold conditioning and test pulses. We investigated whether different circuits mediate these inhibitory phenomena and how they interact. In nine healthy volunteers, we applied TMS to the motor cortex and recorded motor evoked potentials from the first dorsal interosseous muscle. With increasing test pulse strength, LICI decreases but SICI tends to increase. There was no correlation between the degree of SICI and LICI. We tested the interactions between SICI and LICI. SICI was reduced or eliminated in the presence of LICI. Loss of SICI was seen even with a conditioning stimulus too weak to induce significant LICI. Our findings demonstrate that different cell populations mediate SICI and LICI. The results are consistent with the hypothesis that LICI inhibits SICI through presynaptic GABAB receptors. Testing of SICI in the presence of LICI may be a non-invasive way of evaluating inhibitory interactions in the human motor cortex.


Figures

Figure 1
Figure 1. Effects of different test stimulus intensities on cortical inhibition and facilitation
Data from 9 subjects. Inhibition and facilitation are shown as the ratio (mean ±s.e.m.) of the conditioned MEP amplitude to the unconditioned MEP amplitude. Ratios less than 1 indicate inhibition and ratios greater than 1 indicate facilitation. Test pulse strength (0.2, 1, or 4 mV) is specified in terms of the target MEP amplitude evoked by the test pulse alone. SICI tended to increase while LICI decreased with increasing test pulse intensity.
Figure 2
Figure 2. The effect of a preceding CS100 conditioning pulse on SICI
Traces show average MEPs for a single subject. Only trials with test stimulus intensity at 1 mVCS100 are shown. The CS100 stimulus (62% of maximum stimulator output) was adjusted to produce 1 mV MEPs, the CS2 stimulus (35% of maximum stimulator output) set at 80% of resting motor threshold and the test stimulus (83% of maximum stimulator output) was set to produce 1 mV MEPs in the presence of a CS100 stimulus (1 mVCS100). A, response to the test pulse alone (condition 2E). TMS was delivered at 150 ms. B, a preceding CS2 conditioning stimulus at 148 ms leads to inhibition of the test pulse compared to the baseline in A (condition 2F). C, a preceding CS100 conditioning stimulus at 50 ms also leads to inhibition of the test pulse (condition 2H). D, in the presence of a CS100 pulse, the CS2 pulse does not lead to a decrease in the MEP size compared to that shown in C (condition 2I).
Figure 3
Figure 3. Changes in SICI and ICF in the presence of a CS100 stimulus in all 9 subjects (mean ±s.e.m.)
•, ICF; •, SICI. Inhibition and facilitation are shown as the ratio of the conditioned MEP amplitude to the unconditioned MEP amplitude. Ratios less than 1 indicate inhibition and ratios greater than 1 indicate facilitation. Points above a (conditions 2B/2A and 2C/2A) and b (conditions 2F/2E and 2G/2E) represent SICI and ICF without the CS100 stimulus. Points above a show that the test pulse evokes a 1 mV MEP and points above b that the test pulse evokes 1 mV MEP if preceded by a CS100 stimulus. Points above c (conditions 2I/2H and 2J/2H) and d (conditions 3B/3A and 3C/3A) represent SICI and ICF with the CS100 stimulus. The CS100 stimulus evokes a 1 mV MEP and the test MEP evokes a 1 mV MEP in the presence of a CS100 stimulus. Points above c show the CS2/10 was at 80% of resting motor threshold and points above d that the CS2/10 was at 80% of resting motor threshold in the presence of CS100. Points above a, c and d are matched for test MEP amplitude and points above b, c and d are matched for test stimulus intensity.
Figure 4
Figure 4. Averaged EMG tracing from a representative subject in Expt 4
A, response to the test pulse alone (1 mVCS2, 58% of maximum stimulator output). B, addition of a CS2 pulse (0.8MT, 30% of maximum stimulator output) inhibited the test MEP. C, addition of a CS100 pulse at 1.1MT (48% of maximum stimulator output) did not inhibit the test pulse. D, addition of both CS100 (1.1MT) and CS2 pulses (0.8MT) reduced the inhibitory effect of CS2 and led to higher test MEP amplitude compared to those shown in B.
Figure 5
Figure 5. Effects of different CS100 stimulus strengths
A, effects of different strengths of the CS100 stimulus depend on the nature of the baseline MEPs. Data from 9 subjects (mean ±s.e.m.). The MEP amplitudes conditioned by the CS100 stimulus are expressed as a ratio of the baseline MEP amplitudes. •, baseline MEPs with test stimulus intensity of 1 mV (conditions 4H/4G); ▴, baseline MEPs with test stimulus intensity of 1 mVCS2 (conditions 4D/4A); •, baseline MEPs generated by adding CS2 at 0.8MT to the test stimulus at 1 mVCS2 (conditions 4E/4B). • and • are matched for baseline MEP amplitude; • and ▴ are matched for test MEP intensity. The CS100 stimulus tended to cause facilitation of baseline MEPs produced by the CS2-test stimulus pair but inhibition of baseline MEPs produced by the test stimulus alone. B, the effect of different strengths of CS100 pulse on SICI and ICF. Data from 9 subjects. CS2 or CS10 was 0.8MT and the test pulse was 1 mVCS2. ‘0’ on the x-axis represents SICI, ICF and a test pulse alone without the CS100 stimulus. SICI without the CS100 stimulus was calculated from conditions 4B/4A and ICF from conditions 4C/4A. SICI with the CS100 stimulus was calculated from conditions 4E/4D and ICF from conditions 4F/4D. LICI was calculated from conditions 4D/4A. The CS100 pulse caused reduction of SICI at all stimulus intensities tested. C, the effects of CS80 stimulus at 1.1MT on different baseline MEPs. Data from 6 subjects. The symbols used are identical to A. The CS80 stimulus inhibited baseline MEPs produced by the test stimulus alone but facilitated the MEPs produced by the CS2-test stimulus pair.
Figure 6
Figure 6. Models to explain the experimental results
Each box in the figure schematically indicates the population of cells responsible for mediating ‘SICI’, ‘LICI’, ‘ICF’, or the response to the test stimulus alone. The box labeled ‘I’ indicates the source of descending I-waves, and ‘output’ indicates the corticospinal output cell populations. The diagram is for illustration, and the populations may be heterogeneous or include further internal circuitry. The filled circles represent inhibitory synapses, and the letters ‘a’ and ‘b’ indicate the hypothesized presence of primarily GABAA or GABAB receptors.

References

    1. Awiszus F, Feistner H, Urbach D, Bostock H. Characterisation of paired-pulse transcranial magnetic stimulation conditions yielding intracortical inhibition or I-wave facilitation using a threshold-hunting paradigm. Experimental Brain Research. 1999;129:317–324. - PubMed
    1. Burke D, Bartley K, Woodforth IJ, Yakoubi A, Stephen JP. The effects of a volatile anaesthetic on the excitability of human corticospinal axons. Brain. 2000;123:992–1000. - PubMed
    1. Chen R, Corwell B, Yaseen Z, Hallett M, Cohen LG. Mechanisms of cortical reorganization in lower-limb amputees. Journal of Neuroscience. 1998a;18:3443–3450. - PMC - PubMed
    1. Chen R, Garg R. Facilitatory I wave interaction in proximal arm and lower limb muscle representations of the human motor cortex. Journal of Neurophysiology. 2000;83:1426–1434. - PubMed
    1. Chen R, Lozano AM, Ashby P. Mechanism of the silent period following transcranial magnetic stimulation. Evidence from epidural recordings. Experimental Brain Research. 1999;128:539–542. - PubMed

Publication types

LinkOut - more resources