. 2001 Jan 16;98(2):694-9.
doi: 10.1073/pnas.98.2.694.

Dynamic imaging of coherent sources: Studying neural interactions in the human brain

Affiliations

Dynamic imaging of coherent sources: Studying neural interactions in the human brain

J Gross et al. Proc Natl Acad Sci U S A. .

Abstract

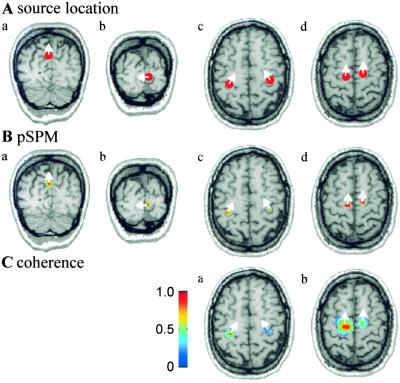
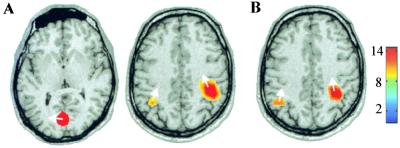
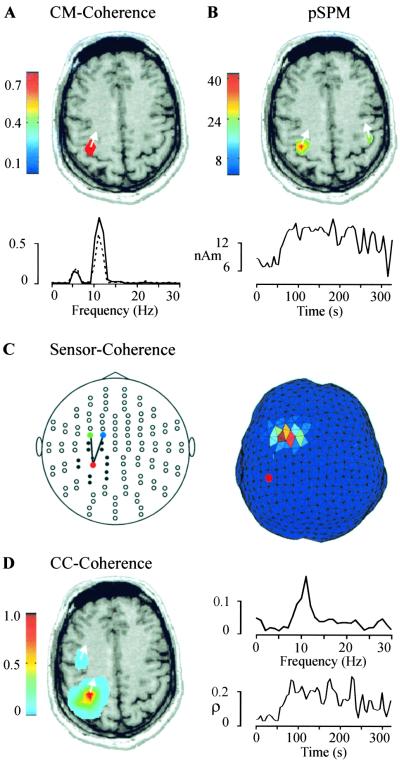
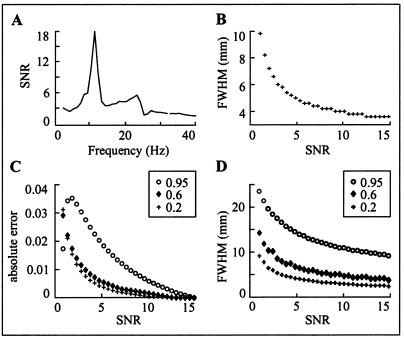
Functional connectivity between cortical areas may appear as correlated time behavior of neural activity. It has been suggested that merging of separate features into a single percept ("binding") is associated with coherent gamma band activity across the cortical areas involved. Therefore, it would be of utmost interest to image cortico-cortical coherence in the working human brain. The frequency specificity and transient nature of these interactions requires time-sensitive tools such as magneto- or electroencephalography (MEG/EEG). Coherence between signals of sensors covering different scalp areas is commonly taken as a measure of functional coupling. However, this approach provides vague information on the actual cortical areas involved, owing to the complex relation between the active brain areas and the sensor recordings. We propose a solution to the crucial issue of proceeding beyond the MEG sensor level to estimate coherences between cortical areas. Dynamic imaging of coherent sources (DICS) uses a spatial filter to localize coherent brain regions and provides the time courses of their activity. Reference points for the computation of neural coupling may be based on brain areas of maximum power or other physiologically meaningful information, or they may be estimated starting from sensor coherences. The performance of DICS is evaluated with simulated data and illustrated with recordings of spontaneous activity in a healthy subject and a parkinsonian patient. Methods for estimating functional connectivities between brain areas will facilitate characterization of cortical networks involved in sensory, motor, or cognitive tasks and will allow investigation of pathological connectivities in neurological disorders.


Figures

Figure 1
Figure 1
Simulations. (A) Locations of simulated sources are indicated as red dots on coronal (a and b) and axial (c and d) MR images. (B) pSPMs calculated in the frequency bands 7–9 Hz (a), 11–13 Hz (b), 20–24 Hz (c), and 17–19 Hz (d). The threshold for the pSPMs corresponds to P < 0.001. (C) Coherence estimates are shown with a threshold of 0.23 in the frequency bands 9–11 Hz (a) and 17–19 Hz (b). The reference point in a was the left hand area, as estimated from the pSPM, and in b the left premotor area. Coherence of the reference region with itself is always equal to 1. The white arrows indicate the dominant direction of current flow.
Figure 2
Figure 2
Localization of the generators of spontaneous activity recorded from a healthy subject at rest with his eyes open. The strongest pSPMs in the (A) 7- to 12-Hz band and (B) 17- to 23-Hz band are shown, overlayed on axial anatomical MRI slices (P < 0.0001). The color bar defines the relation between color and noise-normalized power.
Figure 3
Figure 3
Analysis of cortico-muscular (CM) and cortico-cortical (CC) coupling. (A Upper) The spatial distribution of cortical coherence to EMG from the right FDS muscle, with a threshold of 0.78 in the 9- to 12-Hz frequency band. (Lower) The strongest coherence between EMG and an MEG sensor above M1 (dashed line) is compared with the coherence between EMG and M1 itself (full line; 99% confidence level is 0.014). (B Upper) The pSPM in the 9- to 12-Hz band reveals bilateral hand motor areas (P < 0.0001). (Lower) Amplitude of the left M1 activity in the 9- to 12-Hz band is shown as a function of time. (C) Plot of all sensors, flattened onto a plane, with lines connecting the sensors showing highest coherence in the 9- to 12-Hz band (Left). Only coherences between sensor pairs with a distance of more than 6 cm are shown. All sensors at shorter distance to the sensor marked with a red dot are represented by filled circles. (Right). The coherence estimate on the triangulated brain surface is shown for the 9- to 12-Hz range. The reference point is marked with a red dot. (D Left) The spatial distribution of cortico-cortical coherence to M1 is shown with a threshold of 0.07 in the 9- to 12-Hz band. (Right) A peak at 11 Hz is evident in the coherence spectrum between M1 and PM (Upper). The synchronization index ρ between M1 and PM increases abruptly when tremor strength increases at about 60 s (Lower; 99% confidence level is 0.04).
Figure 4
Figure 4
Testing the performance of DICS. (A) The SNR of spontaneous activity, estimated as the ratio of the frobenius norms of the cross spectral density matrices of data measured from a resting subject (signal) and without a subject (noise). (B) The pSPM FWHM in millimeters plotted for SNR in the range 1 to 15. (C) The absolute error in the coherence estimation for three different coherences (0.2, 0.6, and 0.95) is plotted as function of SNR. (D) The dependence of FWHM of coherence on SNR for three different coherence values (0.2, 0.6, 0.95).

References

    1. Gray C M, König P, Engel A K, Singer W. Nature (London) 1989;338:334–337. - PubMed
    1. Singer W. Neuron. 1999;24:49–65. - PubMed
    1. von der Malsburg C. Neuron. 1999;24:95–104. - PubMed
    1. König P, Engel A K. Curr Opin Neurobiol. 1995;4:511–519. - PubMed
    1. Friston K J, Büchel C. Proc Natl Acad Sci USA. 2000;97:7591–7596. - PMC - PubMed

LinkOut - more resources