

Vision impairment predicts 5 year mortality
- PMID: 11222339
- PMCID: PMC1723877
- DOI: 10.1136/bjo.85.3.322
Vision impairment predicts 5 year mortality
Abstract
Aim: To describe predictors of mortality in the 5 year follow up of the Melbourne Visual Impairment Project (VIP) cohort.
Methods: The Melbourne VIP was a population based study of the distribution and determinants of age related eye disease in a cluster random sample of Melbourne residents aged 40 years and older. Baseline examinations were conducted between 1992 and 1994. In 1997, 5 year follow up examinations of the original cohort commenced. Causes of death were obtained from the National Death Index for all reported deaths.
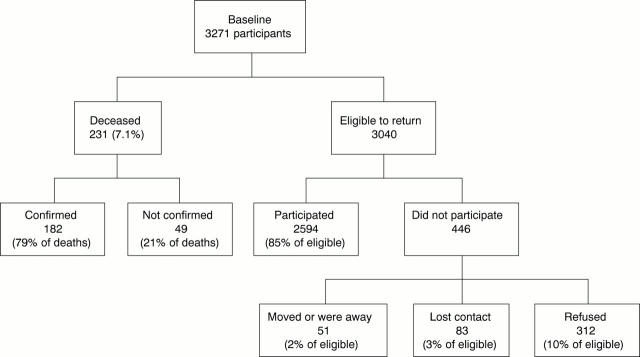
Results: Of the original 3271 participants, 231 (7.1%) were reported to have died in the intervening 5 years. Of the remaining 3040 participants eligible to return for follow up examinations, 2594 (85% of eligible) did participate, 51 (2%) had moved interstate or overseas, 83 (3%) could not be traced, and 312 (10%) refused to participate. Best corrected visual acuity <6/12 (OR=2.34) was associated with a significantly increased risk of mortality, as were increasing age (OR=1.09), male sex (OR=1.62), increased duration of cigarette smoking (OR=2.06 for smoking >30 years), increased duration of hypertension (OR=1.51 for duration >10 years), and arthritis (OR=1.42).
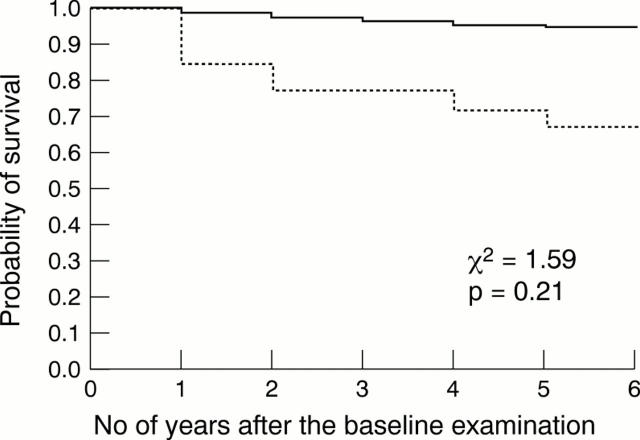
Conclusions: Even mild visual impairment increases the risk of death more than twofold. Further research is needed to determine why decreased visual acuity is associated with increased risk of mortality.
Figures
References
Publication types
MeSH terms
LinkOut - more resources
Full Text Sources